
6/4/2023 Markets were higher for the week, as the FEAR has gone, and FOMO (Fear of Missing Out) and Greed have returned. We like to Buy on FEAR, and take profits on GREED. Currently the Greed Index (SVXY) is very high, and the Fear Index (VIX) is the lowest since Nov. 2021.
Many Investors are also expecting the FED to stop Tightening (raising short term Interest Rates). The Markets are going up and discounting the Good News of no more FED Tightening.
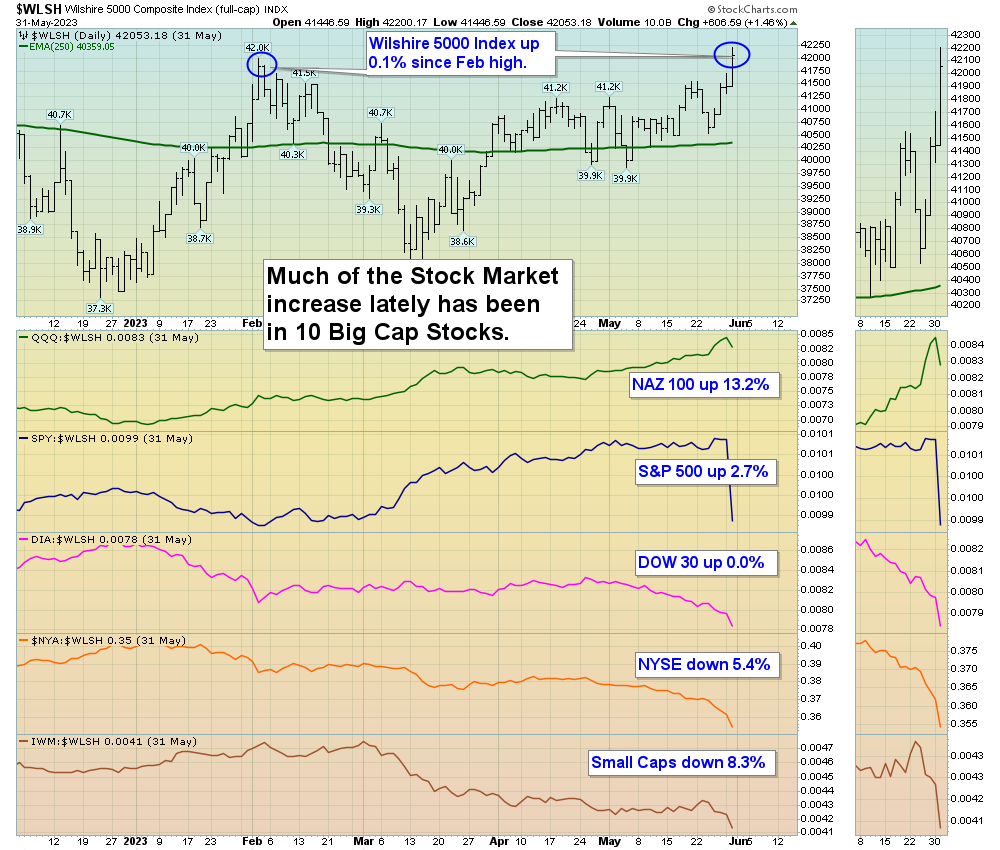
Stock Markets are frustrating now, because new money does not seem to be coming into the Markets, just rotating out of Small Caps and into the very largest Stocks. The broad Wilshire 5000 stock Index is only up +0.1% since the last Feb 2 Market High. Then it dropped 9% as Smart Money sold on extreme Greed levels. Since the Feb high, the Small Caps (IWM) are down -8.3%, NYSE ($NYA) -5.4%, DOW 30 (DIA) 0.0%, S&P 500 (SPY) +2.7%, NASDAQ 100 (QQQ) surged up +13.2%.
Historically when the Market advance is narrow like now, the rally will stall out. So if your investment account value is not higher than the Fed high, you should probably Raise some Cash and then Buy again on the next FEAR Flush (stay in sync with the emotional cycles).
If you continue to Follow the Green Line System, your Money should flow into the Strongest areas and your account value should be able to grow in both Bull and Bear Markets. Follow the MONEY, not the MEDIA.
_____________________________________________________________________________________________
For the week the Dow was up 2.19%, the S&P 500 was up 1.88% and the NASDAQ 100 was up 1.79%. Many of the major Indices still have a Relative Strength below 80, so you should currently own the stronger Securities here.
The Inflation Index (CRB) was down 0.39% for the week and is Below the Green Line, indicating Economic Contraction.
Bonds were up 1.16% for the week, and are Below the Green Line, indicating Economic Expansion.
The US DOLLAR was down 0.18% for the week and is Above the Green Line.
Crude Oil was down 1.28% for the week at $77.74 and GOLD was up 1.30% at $1969.60.
We are now doing micro Day Trades on our new Discord site (free). Please join for mobile notifications during the day. Other methods of notification have been too Slow. Also, please check our our Live Streaming on YouTube during Market hours.
More action this week on the Day Trading Scrolling Charts, and DAY TRADING CHARTS FOR INDICES & LARGE CAPS.
_____________________________________________________________________________________________
MONEY BUYS SOON:
We are in now in 7 logged Swing Trading Positions for the Short & Medium Term. There are 5 investments on the Short Term Watch List.
Be patient and WAIT for Green Zone Buy Signals!
LONG TERM INVESTMENTS:
Long Term Scrolling Charts (Real Time)
CROX CROCS INC. Wait for Weekly Money Wave Close > 20 with High Volume.
EDU ORIENTAL EDUCATION GROUP Buy above $46.63 with High Volume with a 3% Trailing Sell Stop Loss below it.
HIMS HIMS & HERS HEALTH Wait for Weekly Money Wave Close > 20 with High Volume.
PINS PINTEREST INC. Buy above $29.27 with High Volume with a 3% Trailing Sell Stop Loss below it.
SH INVERSE S&P 500 FUND Buy above $17.71 with High Volume with a 3% Trailing Sell Stop Loss below it.
STLD STEEL DYNAMICS INC. Buy above $105.85 with High Volume with a 3% Trailing Sell Stop Loss below it.
STNE STONECO LTD. Buy above $15.01 with High Volume with a 3% Trailing Sell Stop Loss below it.
TAL TAL EDUCATION GROUP Buy above $10.45 with High Volume with a 3% Trailing Sell Stop Loss below it.
__________________________________________________________________________________________
My Trading Dashboard
Swing Trading Scrolling Charts
Day Trading Scrolling Charts
Click for Watch Lists
Click for Current Positions
Click for Closed Positions
Updated Top 100 List Jun 1, 2023
Dividend Growth Portfolio
Updated ETF Sector Rotation System
Dogs of the DOW System
Long Term Strategy for IRAs & 401k Plans
CNN Fear & Greed Index
Scrolling Stage Chart Investing Charts
Alert! Market Risk is Medium (YELLOW). The probability of successful Short Term Trades is better, when the % of stocks above the 50-day avg. is below 20.
Tell your Friends about the Green Line, and Help Animals.
________________________________________________________________________________
QUESTION: Peter writes “I am confused on this. Money Wave > 50. Don’t Take a Loss! What does that mean??”
ANSWER: Hi Peter, If the Money Wave is above 50, and the Investment is not popping up well, something could be wrong.
So Get Out before you lose money. There will be plenty more to Buy soon. Let’s keep our probabilities high.
Good trading and tell your friends!
ATGL
Related Post
– CROX


