
HAPPY FATHER’S DAY!
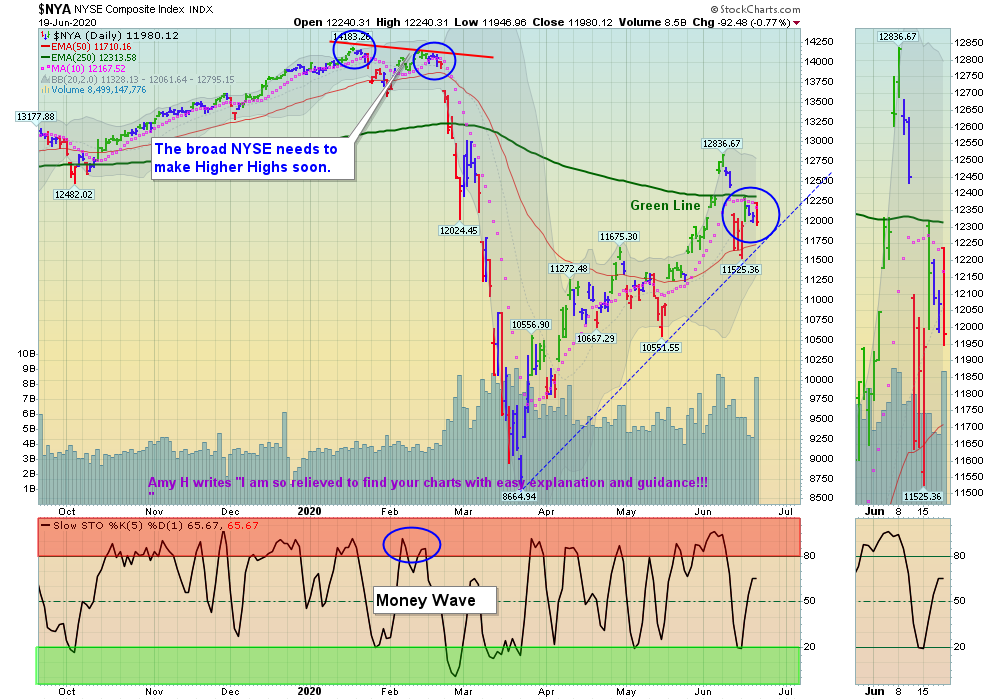
06/21/2020 Markets were up for the week after the Indices went down to the Red Lines (50-day avgs.) and bounced. Now the Indices need to exceed to early June Highs for this rally up to continue.
The Strongest Indices and Leaders were coming back down to the Green Zones last Monday and then the FED panicked and announced more FED Printing (see Massive FED Printing Chart).The Markets quickly popped back up before good Money Wave Buy Signals could be made, so we missed several good trades. The Green Line System is about the “Flow of Money into Investments” and the FED Buying is the same as Investor Buying, but we are cautious as the FED has historically Slowed Down or Stopped Buying without much notice.
So if you trust the FED to Print forever, enjoy the ride up. However when the Leaders are Way Above the Green Line (like now) the probability of a 2:1 Reward / Risk upside move is poor (like it was at the February Highs). News is GOOD now about Businesses opening back up, but the Markets knew that in March before the 40% rally up. Remember, Smart Money Sells on Good News and Buys on Bad News (like at the March Lows).
The Strongest Leaders are in the Red Zones (probably too late to Buy for the Short Term). Please WAIT for the Leaders to return back down to their Green Zones for Money Wave Buy Signals.
For the week the Dow was up 1.09%, the S&P 500 was up 1.90%, and the Nasdaq 100 was up 3.54%. The Long Term Trend for the Indices is up.
The Inflation Index (CRB) was up 2.72% and is Below the Green Line, indicating Economic Weakness.
Bonds were up 0.06% for the week and are Above the Green Line, indicating Economic Weakness.
The US DOLLAR was up 0.46 % for the week and Closed on the Green Line.
Crude Oil was up 9.85% for the week at $39.83 and GOLD was up 0.90% at $1753.00.
_____________________________________________________________________________________________
MONEY WAVE BUYS SOON:
We are currently in 1 logged Current Positions, for the Short & Medium Term. There are 6 Investments on the Short Term Watch List.
Be patient and WAIT for Green Zone Buy Signals!
______________________________________________________________________________________________
LONG TERM INVESTMENTS (Most of the Leaders are back up in the Weekly Red Zones.)
Buy the Leading Investments that are down near the Weekly Green Zones.
AUY YAMANA GOLD Wait for next Daily Green Zone Buy Signal. All time High is $18.50.
LLNW LIMELIGHT NETWORKS INC. Buy if it Closes above $5.62 on High Volume. All time High s $53.40.
NG NOVA GOLD RESOURCES Buy if it Closes above $9.28 on High Volume. All time High s $16.00.
RRC RANGE RESOURCES CORP. Buy if it Closes above $7.14 on High Volume. All time High is $92.45.
______________________________________________________________________________________
Click for Current Positions
Click for Watch List
Click for Closed Positions
Dividend Growth Portfolio (we are now posting a Dividend Calendar for the entire portfolio to assist with planning purposes).
ETF Sector Rotation System – Next Quarterly Rotation will be on June 30, 2020.
Long Term Strategy for IRAs & 401k Plans
Alert! Market Risk is HIGH (Red Zone). The probability of successful Short Term Trades is better, when the % of stocks above the 50-day avg. is below 20.
Tell your Friends about the Green Line, and Help Animals
___________________________________________________________________________________________
QUESTION: RUI writes “On the Current Positions page, what is the parameter to shift the “legend” to yellow “Don’t take a loss?”
ANSWER: Hi Rui. Usually after a Money Wave Buy Signal, the Investment should pop 3-5% in a few days. When the Money Wave is > 50 and the Investment is not doing well, then something might be wrong (maybe the Market has not have bottomed).
So for Short Term Trading we suggest getting out Before you take a Loss, and try to get back in Lower. There will be plenty more to Buy.
Good trading, and tell your friends!