
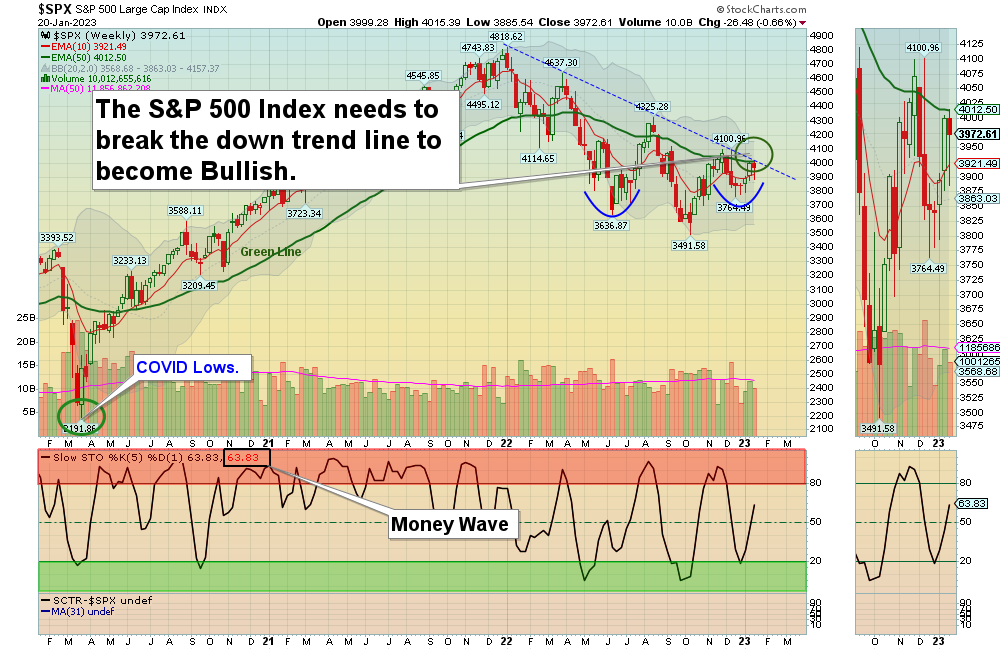
1/22/2023 Markets were mixed for the week as the big DOW 30 Stocks have become weaker, but the big Tech Stocks have firmed up. The S&P 500 Index is back up to the down trend line, and needs to Close above that to be bullish.
Investors are hoping that Inflation has peaked, so long term Interest Rates have dropped recently. But the Inverse Bond Fund (TBT) has high momentum and should go up once more (meaning higher long term Interest Rates for a while). Commodities had been very weak but have recently firmed up from massive spending by Congress. Maybe the massive spending by Congress ($1.7 TRILION recently) is the new “sugar high” for the Markets.
If you continue to Follow the Green Line System, your Money should flow into the Strongest areas and your account value should be able to grow in both Bull and Bear Markets. Follow the MONEY, not the MEDIA..
______________________________________________________________________________________________________________________________________________
For the week the Dow was down 2.65%, the S&P 500 was down 0.66% and the NASDAQ 100 was up 0.61%. Most of the major Indices do not have Relative Strength above 80, so you should currently own the stronger Securities here.
The Inflation Index (CRB) was up 0.92% for the week and is Above the Green Line, indicating Economic Expansion.
Bonds were down 0.52% for the week, and are Below the Green Line, indicating Economic Expansion.
The US DOLLAR was down 0.16% for the week and is Below the Green Line.
Crude Oil was up 2.23% for the week at $81.64 and GOLD was up 0.34% at $1928.20.
More action this week on the Day Trading Scrolling Charts.
DAY TRADING CHARTS FOR INDICES & LARGE CAPS.
We have not had many intra-day Trade Alert signals lately as the Volume has been too Low with the Buy Signals. These low Volume Buy Signals tend to pop up and quickly fade back down. We like to see High Volume on rallies.
_____________________________________________________________________________________________
MONEY WAVE BUYS SOON:
We are in now in 6 logged Current Positions for the Short & Medium Term. There are 4 investments on the Short Term Watch List.
Be patient and WAIT for Green Zone Buy Signals!
LONG TERM INVESTMENTS: (It is still hard to find many Long Term now because most normal Investments no longer have 80 Relative Strength required.)
Long Term Scrolling Charts (Real Time)
ENPH ENPHASE ENERGY INC. Buy above $260.98 with High Volume with a 3% Trailing Sell Stop Loss below it.
HRB H&R BLOCK INC. Buy above $38.66 with High Volume with a 3% Trailing Sell Stop Loss below it.
SH INVERSE S&P 500 FUND Buy above $17.71 with High Volume with a 3% Trailing Sell Stop Loss below it.
TWNK HOSTESS BRANDS Buy above $23.49 with High Volume with a 3% Trailing Sell Stop Loss below it.
VIPS VIPSHOP HOLDINGS Buy on the next Daily Money Wave Buy Signal. (Soon)
______________________________________________________________________________________________________
My Trading Dashboard
Swing Trading Scrolling Charts
Day Trading Scrolling Charts
Click for Watch Lists
Click for Current Positions
Click for Closed Positions
Updated Top 100 List Jan 2, 2023
Dividend Growth Portfolio
Updated ETF Sector Rotation System
Dogs of the DOW System
Long Term Strategy for IRAs & 401k Plans
CNN Fear & Greed Index
Scrolling Stage Chart Investing Charts
Alert! Market Risk is Medium (YELLOW). The probability of successful Short Term Trades is better, when the % of stocks above the 50-day avg. is below 20.
Tell your Friends about the Green Line, and Help Animals.
________________________________________________________________________________
QUESTION: Winter writes ““Don’t take a Loss” confuses me. What does that mean?”
ANSWER: When the Investment has a Money Wave Buy Signal, it should pop up 3-6 % in just a few days.
If it is not popping up well, and the Money Wave > 50, either Get Out even, or Don’t Take a Loss!
Something must be Wrong. There will be plenty more… Raise Cash, and don’t get Stuck! Wait for the next one.
Good trading and tell your friends!
ATGL
Related Post
– ENPH