Above the Green Line -01
  • Market Insights
        • Commentary
          • Daily
          • Weekly
        • BUY / SELL SIGNALS
          • Trade Posts
          • Recent Trade Alerts
          • Recent Day Trades
        • BLOGROLL
          • Dividend Growth Blog
          • ETF Sector Blog
          • Dow Dogs
          • TPOW Blog
  • Strategies
        • SWING TRADING
          • Current Positions
          • Watchlists
          • Closed Positions
          • Candidates - TOP 100
          • Specialty Stocks
        • WEEKLY STOCK PICK
          • TPOW Charts
          • TPOW Performance
          • TPOW Strategy Guide
          • TPOW Performance Dashboard
        • DAY TRADING
          • Watch List
        • ATGL DASHBOARD
        • ETF STRATEGIES
          • ETF Sector Rotation
          • ETF Sector Portfolio
        • DIVIDEND GROWTH
          • Dividend Growth Portfolio
          • Dividend Calendar
        • DOGS OF THE DOW
          • Dogs of the Dow Portfolio
          • DOW 5 Portfolio
  • Markets
        • US MARKET
          • Commodities
          • Energy
          • Precious Metals
          • Volatility
        • GLOBAL MARKETS
          • Market Indices
          • Economic Calendar
          • FOREX Heat Map
          • FOREX Cross Rates
          • Crypto Currency Market
  • Investing
    • Discord Community
    • Dashboard
  • Resources
        • ARTICLES
          • Dividend Growth Model Articles
          • ETF Articles
          • Investment Strategies Articles
          • Market and Economic Insights
          • Stock Trade Articles
          • Stock Reviews
        • TOOLS
          • Stock Scanners
          • Charting Software
          • Brokerage Firms
        • STOCK CHARTS
          • Key Components
          • Reading Charts
          • Drawing Stock Charts
          • Identifying Trends
        • RETIREMENT PLANNING
  • About
    • Contact Us
    • How to Win
    • #1 At Stockcharts
    • Disclaimer
    • FAQ
  • Log In
  • Subscribe

January 10, 2021

Green Line Weekly Jan 10, 2021

XLK Chart
The Tech Fund (XLK) made New Highs, but the Relative Strength is dropping.

1/10/2021 Markets were higher for the week as Investors hoped for massive Gov’t. spending this year. Commodity prices surged, along with Solar and Clean Energy. But Bonds broke Support on Inflation Fears. Many of the major Indices are on Highs but are very over-bought.  

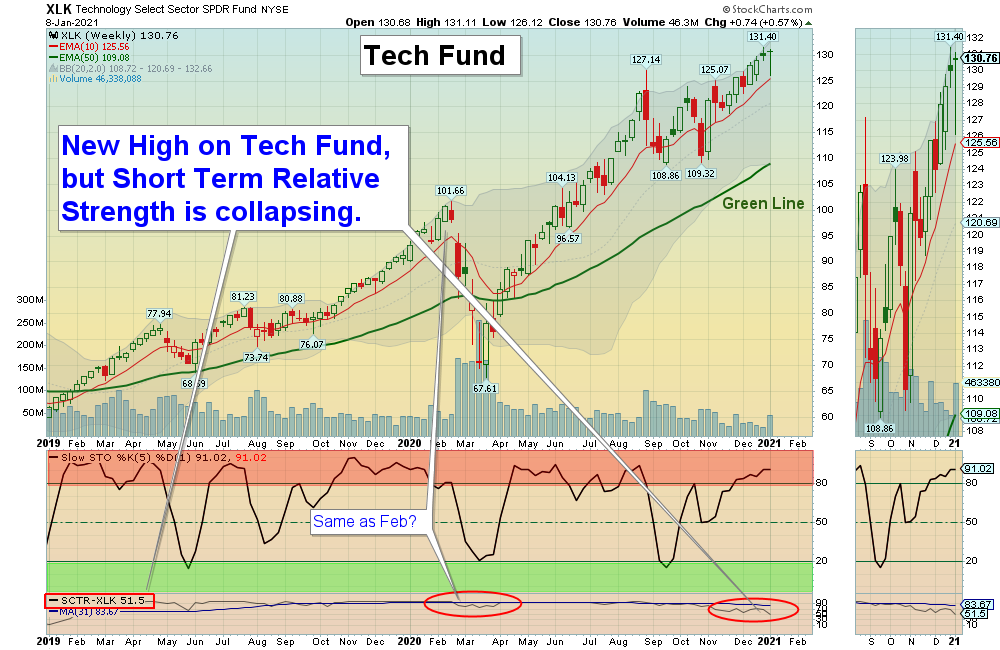
Higher Inflation would normally put pressure on Bond Prices, which could be the catalyst for the Markets to return to their Green Lines again. Historically the Markets are too far Above the Green Lines to justify a 2:1 Reward / Risk Ratio. So prudent Investors who like to Buy on FEAR should be raising Cash up here.

2021 Green Line Trading Results:

  1. TRIL   TRILLIUM THERA. was Sold on the Close for a 22.9 % Gain.
  2. OPEN      OPENDOOR TECH   was Sold on the Close for a 15.9 % Gain. 

SEE SUPPLEMENTAL CHARTS

NEW:  VOLATILITY SCROLLING CHARTS

NEW:  COMMODITIES SCROLLING CHARTS

For the week the Dow was up 1.72%, the S&P 500 was up 1.97%, and the Nasdaq 100 was up 1.68%. The Long Term Trend for the Indices is up. 

The Inflation Index (CRB) was up 3.31% for the week and is Above the Green Line, indicating Economic Expansion.

Bonds were down 4.04% for the week, and are Below the Green Line, indicating Economic Expansion.

The US DOLLAR was up 0.12% for the week, but made a New Low. 

Crude Oil was up 7.67% for the week at $52.24 and GOLD was down 3.15%  at $1835.40.

_____________________________________________________________________________________________

MONEY WAVE BUYS SOON

We are currently in 4 logged Current Positions, for the Short & Medium Term.  There are only 2 Investments on the Short Term Watch List. 

Be patient and WAIT for Green Zone Buy Signals!

______________________________________________________________________________________________

LONG TERM INVESTMENTS  (Most of the Leaders are back up in the Weekly Red Zones.)

Buy the Leading Investments that are down near the Weekly Green Zones.      


BNTX      BIONTECH SE      Popped up 23 % this week, but Volume was not High. Missed it.

CRON      CRONOS GROUP      Popped up 30 % this week. Buy if it Closes above $9.15 on High Volume.     

CYH      COMMUNITY HEALTH      Popped up 8 % for the week, but Volume was not High.     

MRNA      MODERNA INC.      Buy above $122.82 on High Volume.

OSTK      OVERSTOCK.COM      Wait for Close Above the Daily Red Line.

RIOT      RIOT BLOCKCHAIN      Up another 56 % this week. Wait for the next Daily Money Wave Buy Signal.

ZM       ZOOM VIDEO      Wait for Close Above the Daily Red Line.

______________________________________________________________________________________

Click for  Watch Lists
Click for  Current Positions
Click for  Closed Positions

New: My Trading Dashboard

Day Trading Watch List

TOP 100 LIST Jan 3, 2021

Dividend Growth Portfolio  

ETF Sector Rotation System      On Dec 31, 2020, the 5 Funds were Sold on the Close. On Jan 4, 2020, 20 % of the account value will be allocated into these 5 Funds: SPY, EEM, SLV, IWM & QQQ on the Close. (Or you can just swap EFA for IWM, and try for 20 % allocation in each of 5 Funds).

Dogs of the DOW System  All positions were Close and New ones will be determined on Monday Jan 4.

Long Term Strategy for IRAs & 401k Plans

CNN Fear & Greed Index

Alert! Market Risk is HIGH (Red Zone). The probability of successful Short Term Trades is better, when the % of stocks above the 50-day avg. is below 20. 

Tell your Friends about the Green Line, and Help Animals.

___________________________________________________________________________________________

4 Ways to Get your Daily Money Wave Alert:

  • Emailed to your box between 3:30 3:50pm EST.
  • Website menu Commentary/Buy/Sell Signals
  • Twitter notifications for Day Trading Alerts @AboveGreenLine
  • Text messages: Email us your Cell number & phone carrier.

Thank you,

AGL


Related Post

– Green Line Weekly Jan 3, 2021

Subscribe to Our Newsletter

AGL Logo

Get our eBook Now!

Candlestick - A Swing Traders Friend

We don’t spam! Read our privacy policy for more info.

You’ve been successfully subscribed to our newsletter!

Voted #1 at Stock Charts

SH Chart
Inverse S&P 500 Fund (SH) will have a Money Wave Buy today.

Help Us Help Animals

Help Us Help Animals

Recent Comments

  • Market Breadth Indicators: A Trader’s Guide to Early Trend Detection on Backtesting: Definition and How a Trading Strategy Backtest Works
  • Island Reversal Pattern: Definition and Formation Explained on Double Top Pattern: How to Identify and Trade This Reversal Signal
  • Channel Pattern Guide: What It Is and Why It Matters on A Guide to Forecasting Using Moving Averages
  • What Is a Broadening Bottom Chart Pattern? Full Guide on Bull vs. Bear Market: An Investor’s Guide to Market Phases
  • ATGL Weekly Money Flow - 2025-05-11 on ATGL Top Pick of the Week! Apr 6, 2025

Become a Green Liner!

Help me make more Money in the Stock Market.

ON ATGL

  • DashBoard
  • Weekly Commentary
  • Daily Buy / Sell Signals
  • Day Trade Setup
  • Trading Rooms

Design & Develop By Pixelvect

STRATEGIES

  • Swing Trading
  • ATGL Pick of the Week
  • Dividend Growth
  • ETF Sector Rotation
  • Dogs of the Dow

HELP

  • ATGL Trading Rules
  • FAQ
  • Account Maintenance
  • Contact US
  • Join

FOLLOW US

Instagram Linkedin Twitter Facebook

© COPYRIGHT 2024 · ABOVETHEGREENLINE.COM · ALL RIGHTS RESERVED · PRIVACY · TERMS · CONTACT · WATCHLIST · CURRENT