
Watch List and Charts to Buy Soon.
| Daily Swing Watch List to Buy | Daily Swing Charts to Buy |
| Current Daily Swing Positions | Current Swing Charts |
| Closed Daily Swing Results | Trading Dashboard |
2/25/2024 Markets were higher for the week as TECH Earnings moved the Indices up. The Big 7 stocks have now narrowed to Big 2 (NVDA & META), for making higher highs. The Markets are still over bought from the steep rally since late October, and will eventually correct.
We Buy the strongest Leaders on pull-backs. Historically there will always be Securities making highs with high Relative Strength, and we should Buy them on pull backs.
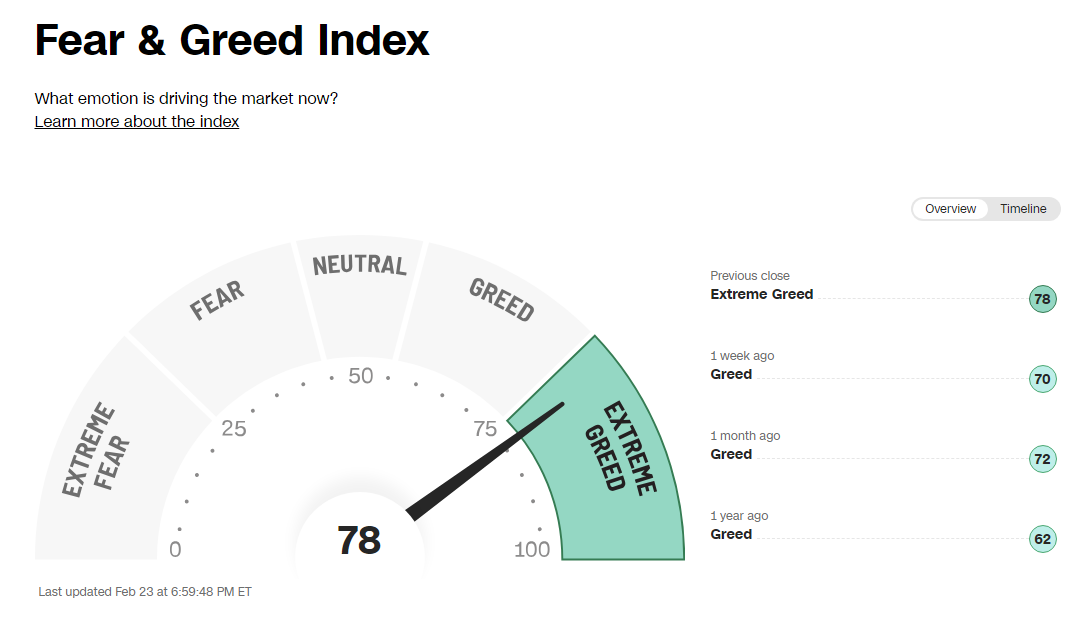
Greed is high now, so be cautious. We like to Buy on Bad News like in late October, and take profits on Good News (Great Earnings now). There will be another FEAR Flush by the Media to scare out investors who are Buying now, Way Above the Green Lines. But we will be ready to Load Up on the next FEAR Flush.
If you continue to Follow the Green Line System, your Account should flow into the Strongest areas and your Account value should be able to grow in both Bull and Bear Markets. Follow the MONEY, not the MEDIA.
______________________________________________________________________________
For the week the Dow was up 1.32%, the S&P 500 was up 1.67% and the NASDAQ 100 was up 1.44%. Many of the major Indices still have a Relative Strength below 80, so you should currently own the stronger Funds here.
The Inflation Index (CRB) was down 0.65% for the week and is Below the Green Line, indicating Economic Contraction.
Bonds were up 1.20% for the week, and are Below the Green Line, indicating Economic Expansion.
The US DOLLAR was down 0.31% for the week and is Above the Green Line.
Crude Oil was down 2.51% for the week at $76.49 and GOLD was up 1.25% at $2049.40.
_______________________________________________________________________
We are doing many micro Day Trades on our new Discord Trading Hub (free). Please join Discord on your cell phone app for the fastest Trade Alerts and Daily email notifications during the day. Other methods of notification have been too slow. Also, please check our our Live Trading Room on YouTube during Market hours.
More action this week on the Day Trading Scrolling Charts, and Day Trading Charts for Indices & Large Caps.
_____________________________________________________________________________
MONEY BUYS SOON:
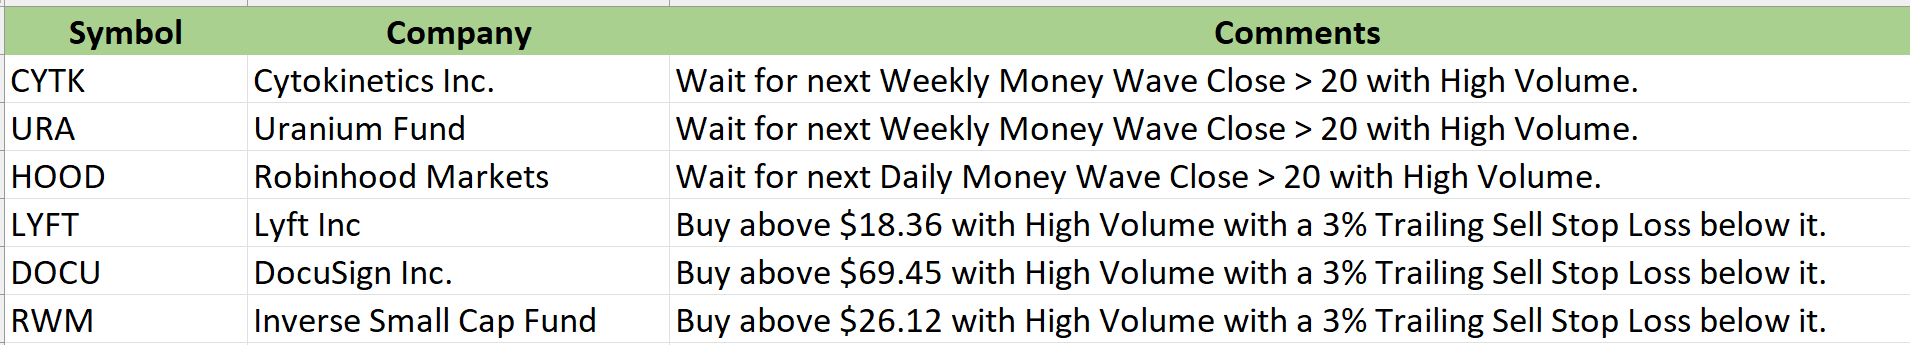
We are now in 5 Three Star logged Swing Trading Positions for the Short & Medium Term. There are 4 investments on the Short Term Watch List.
Be patient and WAIT for Green Zone Buy Signals!
LONG TERM WATCH LIST:
Important Links
| Top 100 | Stage Chart Investing | CNN Fear & Greed Index |
| Dividend Growth Portfolio | ETF Sector Portfolio | Dogs of the Dow |
| Long Term Strategy | Stage Chart Investing | Articles |
Alert! Market Risk is Medium (YELLOW). The probability of successful Short Term Trades is better, when the % of stocks above the 50-day avg. is below 20.
Tell your Friends about the Green Line, and Help Animals.
______________________________________________________________________________
QUESTION: Jeff writes “Hello, in trying to understand your DONT TAKE A LOSS comments, why don’t you raise the stop loss when the stock is up so much? I am not capturing a lot of upside as I get out conservatively (I stopped myself out at 20% on this trade). Is the point to let them run with a large stop loss to capture maximum upside?
ANSWER: Hi Jeff. When the Money Wave > 50, then the Stop is raised to the Buy Price. (Don’t Take a Loss!).
Holding on for more could be determined by calculating a Reward / Risk ratio of 2:1 (which could say SELL). Some members may be longer term, or like to follow the Selling Rules.
Thanks for writing.
ATGL
Related Post
– CVNA


