
Watch List and Charts to Buy Soon.
| Daily Swing Watch List to Buy | Daily Swing Charts to Buy |
| Current Daily Swing Positions | Current Swing Charts |
| Closed Daily Swing Results | Trading Dashboard |
2/18/2024 Markets were mostly lower for the week as the Big 7 stocks stalled out on profit taking. The Markets are still over bought from the steep rally since late October, and will eventually correct. Many worry about this.
But remember. we Buy the strongest Leaders on pull-backs. Historically there will always be Securities making highs with high Relative Strength, and we should Buy them on pull backs. They might not be traditional S&P 500 Stocks, but these Securities should have High Volume and Relative Strength to meet the Green Line Rules.
Greed is high now, so be cautious. We like to Buy on Bad News like in late October, and take profits on Good News (Great Earnings now). There will be another FEAR Flush by the Media to scare out investors who are Buying now, Way Above the Green Lines. But we will be ready to Load Up on the next FEAR Flush.
If you continue to Follow the Green Line System, your Account should flow into the Strongest areas and your Account value should be able to grow in both Bull and Bear Markets. Follow the MONEY, not the MEDIA.
______________________________________________________________________________
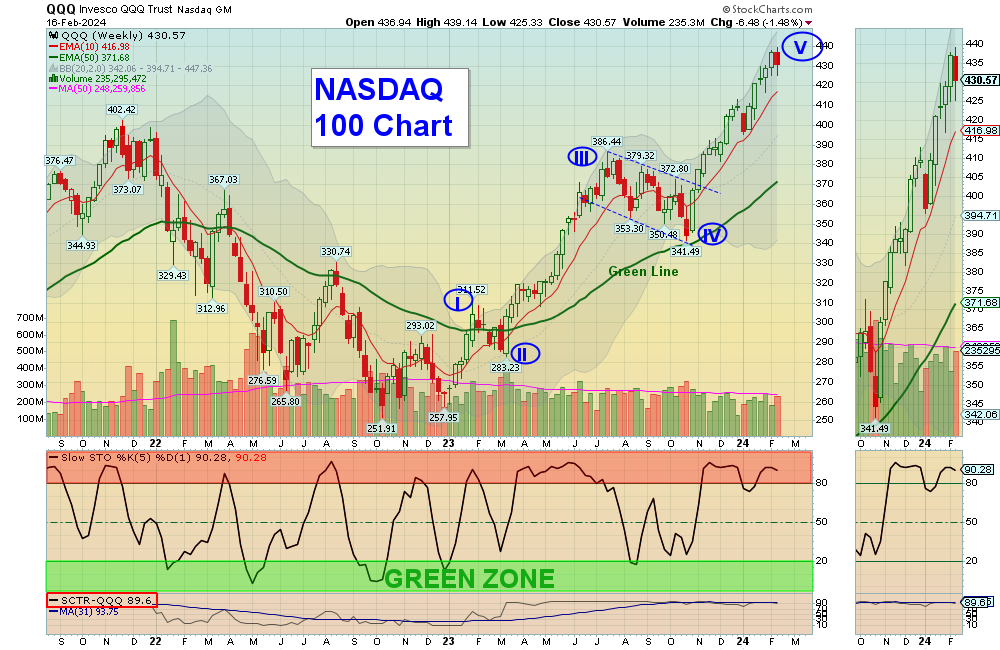
For the week the Dow was down 0.14%, the S&P 500 was down 0,34% and the NASDAQ 100 was down 1.48%. Many of the major Indices still have a Relative Strength below 80, so you should currently own the stronger Funds here.
The Inflation Index (CRB) was down 0.64% for the week and is Above the Green Line, indicating Economic Expansion.
Bonds were down 1.14% for the week, and are Below the Green Line, indicating Economic Expansion.
The US DOLLAR was up 0.18% for the week and is Above the Green Line.
Crude Oil was up 2.11% for the week at $78.46 and GOLD was down 0.72% at $2024.10.
_______________________________________________________________________
We are doing many micro Day Trades on our new Discord Trading Hub (free). Please join Discord on your cell phone app for the fastest Trade Alerts and Daily email notifications during the day. Other methods of notification have been too slow. Also, please check our our Live Trading Room on YouTube during Market hours.
More action this week on the Day Trading Scrolling Charts, and Day Trading Charts for Indices & Large Caps.
_____________________________________________________________________________
MONEY BUYS SOON:
We are now in 4 Three Star logged Swing Trading Positions for the Short & Medium Term. There are 3 investments on the Short Term Watch List.
Be patient and WAIT for Green Zone Buy Signals!
LONG TERM INVESTMENTS:
Long Term Scrolling Charts (Real Time)
COIN COINBASE GLOBAL Target was Hit this week at $185 for a 30.3 % Gain.
CVNA CARVANA CO. Buy above $62.59 with High Volume with a 3% Trailing Sell Stop Loss below it.
DOCU DOCUSIGN INC. Buy above $69.45 with High Volume with a 3% Trailing Sell Stop Loss below it.
HOOD ROBINHOOD MARKETS Wait for next Daily Money Wave Close > 20 with High Volume.
KOPN KOPIN CORP. Bought above $2,50 but the Volume was not High. Target $5.00. LYFT LYFT INC. Buy above $18.36 with High Volume with a 3% Trailing Sell Stop Loss below it.
MSOS CANNIBIS FUND Bought on Daily Money Wave Close > 20 with High Volume. Target is $14.25.
______________________________________________________________________________
| Top 100 | Stage Chart Investing | CNN Fear & Greed Index |
| Dividend Growth Portfolio | ETF Sector Portfolio | Dogs of the Dow |
| Long Term Strategy | Stage Chart Investing | Articles |
Alert! Market Risk is Medium (YELLOW). The probability of successful Short Term Trades is better, when the % of stocks above the 50-day avg. is below 20.
Tell your Friends about the Green Line, and Help Animals.
______________________________________________________________________________
QUESTION: Jose M writes “Morning, I seem to have difficulties on finding the Money Wave chart on the ETFs. Thanks.”
ANSWER: First go to MY TRADING DASH BOARD. Then the Charts with the Money Waves can be pulled up by clicking on the Symbol of the Investment on the Watch List or Current Positions links in every Daily email.
The Money Wave is the Red and Green Zone on the bottom part of the Chart. Buy when the Money Wave has gone down into the Green Zone, and then turns up above 20.
Related Post
– COIN


