
Markets will be Closed on Monday Feb 19, 2018 for a Federal Holiday.
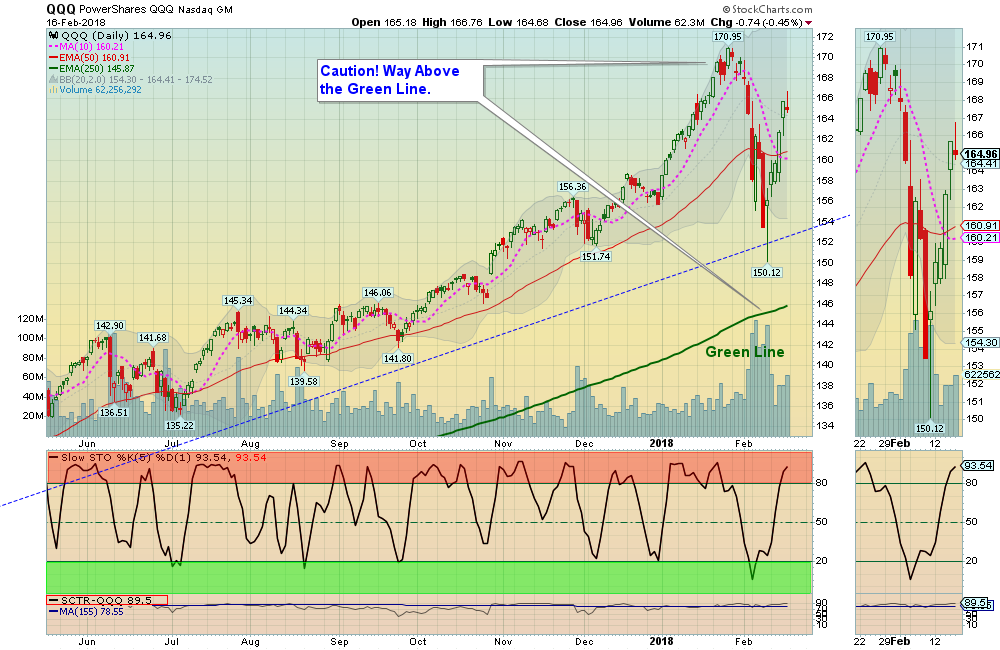
02/18/2018: Markets were up more than 4% for the week, as the S&P 500 almost tagged the Green Line just 6 trading days ago. That was the first correction in 16 months. The major Indices are back up in the Red Zones (probably too late to Buy for the Short Term), so we have been taking quick profits on some trades.
Last week Equity Investments reached the most over-sold level in 2 years. The Long Term Trend is UP.
Bonds are now over-sold and might have a move up near the Red Line (50-day avg.) But Bonds have Low Relative Strength, and are Below the Green Line (which means more Sellers than Buyers).
The Inflation Index (CRB) was not able to hold above the 196.36 Break Out level, which shows some weakness with Inflation. The US DOLLAR bounced is near the Lows, but is over-sold also.
Crude Oil was up 4% for the week at $61.55, and GOLD was up 3%.
___________________________________________________________________________________________
MONEY WAVE BUYS SOON: We are currently in 6 logged Open Positions, for the Short & Medium Term. There are 0 Investments on the Short Term Watch List, so be patient and WAIT for Green Zone Buys!
______________________________________________________________________________________________
LONG TERM TRADES
The Funds below are currently out of favor, but historically these could possibly Double or more from these lower levels. We are looking for a good Entry Point for these, but need the entire Economy & Inflation to pick up speed:
DBC COMMODITY FUND Relative Strength is back Below 90.
FCX FREEPORT MCMORAN Wait for the next Green Zone Buy on the Daily Chart.
JJC COPPER FUND Wait for the next Green Zone Buy on the Daily Chart.
KOL COAL FUND Wait for the next Green Zone Buy on the Daily Chart.
REMX RARE EARTH FUND Wait for Green Zone Buy on the Daily Chart.
TWTR TWITTER INC. Broke Out Above $25.85. Wait for Daily Green Zone.
UGA US GASOLINE FUND Volume is too low… Break Out Above $33.07.
VALE VALE DE RIO Wait for the next Green Zone Buy on the Daily Chart.
___________________________________________________________________________________________
Click for Portfolio (Open Positions)
Click for Watch List
Click for Closed Positions
Alert! Market Risk is MEDIUM (Yellow Zone). The probability of successful Short Term Trades is higher, when the S&P 500 is down near the Green Line. The Strongest Investments should re-test their Highs from these Over-Sold levels.
Tell your Friends about the Green Line, and Help Animals.
QUESTION: Amit writes “Hi, You give the idea of good stocks. No doubt it goes up one day..but most of time I am not able to catch as once you give alert by 1.40 pm MST then it was already up. Is this possible for you to send alert early or is there any way to catch it?”
ANSWER: Hi Amit, and thank you for writing. If the Daily Money Wave (Slow Stochastic) looks like it will Close > 20, many will go to the 60-min Chart and try to get in early.
On the 60-min Chart, wait for a Triple Buy Signal (1. Above the Pink Line 2. 60-min Money Wave > 20 3. MACD Buy Signal).
Usually the 60-min Chart will get you a better price. The 60-min Charts are on the Watch List with the Green Circle links.
For the web site we only use Daily Closing Prices for simplicity, which is normally a disadvantage. You can shop for better prices during the day.
Good trading, and tell your friends!


