
HAPPY EASTER!
4/9/2023 Markets were mixed for the week, even with long term Interest Rates dropping more. Falling long term Interest are telling us that the massive FED Tightening has caused the Economy to slow down.
Many are hoping that the FED has finished Tightening, and later the Economy will pick up speed. But historically the FED over Tightens and causes a slow down.
Currently the S&P 500, DOW 30, and NASDAQ 100 are back Above the Green Line, but the Green Line is flat, indicating Indecision. So we will have to WAIT for the Markets to break to the upside or downside, and tell us which direction the Money will flow. We will keep Buying strong investments on pull-backs, and not worry about it.
If you continue to Follow the Green Line System, your Money should flow into the Strongest areas and your account value should be able to grow in both Bull and Bear Markets. Follow the MONEY, not the MEDIA.
______________________________________________________________________________________________
For the week the Dow was up 0.69%, the S&P 500 was down 0.05% and the NASDAQ 100 was down 0.90%. Most of the major Indices have a Relative Strength below 80, so you should currently own the stronger Securities here.
The Inflation Index (CRB) was up 1.59% for the week and is Above the Green Line, indicating Economic Expansion.
Bonds were up 2.29% for the week, and are Below the Green Line, indicating Economic Expansion.
The US DOLLAR was down 0.65% for the week and is Below the Green Line.
Crude Oil was up 6.65% for the week at $80.70 and GOLD was up 2.02% at $2026.40.
More action this week on the Day Trading Scrolling Charts. and Live Streaming.
DAY TRADING CHARTS FOR INDICES & LARGE CAPS.
We have now doing micro trades on our new Discord site (free).Please join for mobile notifications during the day. Other methods of notification have been too Slow. Also, please check our our Live Streaming during Market hours.
_____________________________________________________________________________________________
MONEY BUYS SOON:
We are in now in 7 logged Swing Trading Positions for the Short & Medium Term. There are 6 investments on the Short Term Watch List.
Be patient and WAIT for Green Zone Buy Signals!
LONG TERM INVESTMENTS:
Long Term Scrolling Charts (Real Time)
CAH CARDINAL HEALTH Target was Hit at $80 for a 6 % Gain.
CHWY CHEWY INC. Buy above $52.88 with High Volume with a 3% Trailing Sell Stop Loss below it.
RRPIX RISING RATES FUND Wait for Weekly Money Wave Close > 20 with High Volume.
SH INVERSE S&P 500 FUND Buy above $17.71 with High Volume with a 3% Trailing Sell Stop Loss below it.
TAL TAL EDUCATION GROUP Buy above $10.45 with High Volume with a 3% Trailing Sell Stop Loss below it.
XOM EXXON MOBIL CORP. Target was Hit at $117 for a 6.7 % Gain.
__________________________________________________________________________________________
My Trading Dashboard
Swing Trading Scrolling Charts
Day Trading Scrolling Charts
Click for Watch Lists
Click for Current Positions
Click for Closed Positions
Updated Top 100 List Apr 1, 2023
Dividend Growth Portfolio
Updated ETF Sector Rotation System
Dogs of the DOW System
Long Term Strategy for IRAs & 401k Plans
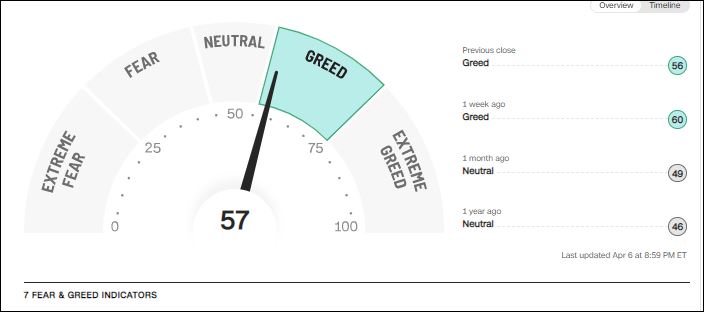
CNN Fear & Greed Index
Scrolling Stage Chart Investing Charts
Alert! Market Risk is Medium (YELLOW). The probability of successful Short Term Trades is better, when the % of stocks above the 50-day avg. is below 20.
Tell your Friends about the Green Line, and Help Animals.
________________________________________________________________________________
QUESTION: RUI writes “On the Current Positions page, what is the parameter to shift the “legend” to yellow “Don’t take a loss?”
ANSWER: Hi Rui. Usually after a Money Wave Buy Signal, the Investment should pop 3-5% in a few days. When the Money Wave is > 50 and the Investment is not doing well, then something might be wrong (maybe the Market has not have bottomed).
So for Short Term Trading we suggest getting out Before you take a Loss, and try to get back in Lower. There will be plenty more to Buy.
Good trading, and tell your friends!
Related Post
– CAH


