
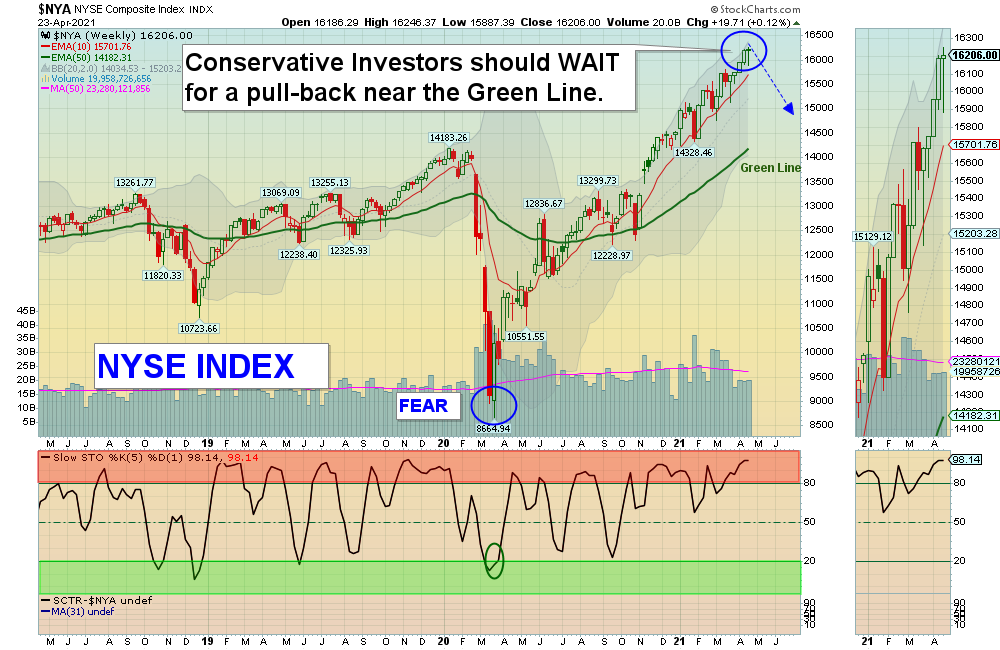
4/25/2021 Markets were mixed for the week and the S&P 500, the NASDAQ 100, and DOW 30 Indices could not push thru to make Higher Highs above last week. Markets are very extended (+85 % in the last year) and it is hard to make much Money lately. Smart Money is not Buying up here on the Highs. Conservative Investors should be patient and WAIT for the Indices to return near the Green Lines (like they always do).
There are several Long Term Investments below that have already corrected 30 % (down near the Green Lines) and should pop back up again. The Momentum Stocks got way over-bought after Tammy panic bought them on the Highs, and now some are on Sale as Tammy Sells on Fear. Remember: Buy Fear and Sell Greed. The Green Line is simply a one year average price of an Investment, with Human Emotions (Fear & Greed) taken out. Follow your roadmap.
For the week the Dow was down 0.42%, the S&P 500 was down 0.12%, and the Nasdaq 100 was down 0.76%. The Long Term Trend for the Indices is up.
The Inflation Index (CRB) was up 1.47% for the week and is Above the Green Line, indicating Economic Expansion.
Bonds were up 0.57% for the week, and are Below the Green Line, indicating Economic Expansion.
The US DOLLAR was down 0.81% for the week.
Crude Oil was down 1.66% for the week at $62.14 and GOLD was up 0.13% at $1777.80.
_____________________________________________________________________________________________
MONEY WAVE BUYS SOON
We are currently in 5 logged Current Positions, for the Short & Medium Term. There are 2 Investments on the Short Term Watch List.
Be patient and WAIT for Green Zone Buy Signals!
______________________________________________________________________________________________
LONG TERM INVESTMENTS (Several Leaders have pulled back, but Markets are on Highs.)
BE BLOOM ENERGY CORP. Buy if it Closes above the Red Line (50-day avg.) with High Volume.
FCEL FUELCELL ENERGY INC. Buy if it Closes above the Red Line (50-day avg.) with High Volume.
ICLN GLOBAL CLEAN ENERGY FUND Buy if it Closes $24.94 with High Volume.
LAC LITHIUM AMERICAS FUND Buy if it Closes above the Red Line (50-day avg.) with High Volume
PLUG PLUG POWER INC. Buy if it Closes $37.75 with High Volume.
XBI BIOTECH FUND Buy if it Closes above the Red Line (50-day avg.) with High Volume.
XOP OIL & GAS EXPLORATION FUND Buy if it Closes above the Red Line (50-day avg.) with High Volume.
______________________________________________________________________________________
Click for Watch Lists
Click for Current Positions
Click for Closed Positions
New: My Trading Dashboard
Day Trading Watch List
NEW TOP 100 LIST Apr 4, 2021
Dividend Growth Portfolio
ETF Sector Rotation System
Dogs of the DOW System
Long Term Strategy for IRAs & 401k Plans
CNN Fear & Greed Index
Scrolling Stage Chart Investing Charts
Alert! Market Risk is HIGH (Red Zone). The probability of successful Short Term Trades is better, when the % of stocks above the 50-day avg. is below 20.
Tell your Friends about the Green Line, and Help Animals.
___________________________________________________________________________________________
QUESTION: Jose M writes “Morning, I seem to have difficulties on finding the Money Wave chart on the ETFs. Thanks.”
ANSWER: First go to MY TRADING DASH BOARD. Then the Charts with the Money Waves can be pulled up by clicking on the Symbol of the Investment on the Watch List or Current Positions links in every Daily email.
The Money Wave is the Red and Green Zone on the bottom part of the Chart. Buy when the Money Wave has gone down into the Green Zone, and then turns up above 20.
