Above the Green Line -01
  • Market Insights
        • Commentary
          • Daily
          • Weekly
        • BUY / SELL SIGNALS
          • Trade Posts
          • Recent Trade Alerts
          • Recent Day Trades
        • BLOGROLL
          • Dividend Growth Blog
          • ETF Sector Blog
          • Dow Dogs
          • TPOW Blog
  • Strategies
        • SWING TRADING
          • Current Positions
          • Watchlists
          • Closed Positions
          • Candidates - TOP 100
          • Specialty Stocks
        • WEEKLY STOCK PICK
          • TPOW Charts
          • TPOW Performance
          • TPOW Strategy Guide
          • TPOW Performance Dashboard
        • DAY TRADING
          • Watch List
        • ATGL DASHBOARD
        • ETF STRATEGIES
          • ETF Sector Rotation
          • ETF Sector Portfolio
        • DIVIDEND GROWTH
          • Dividend Growth Portfolio
          • Dividend Calendar
        • DOGS OF THE DOW
          • Dogs of the Dow Portfolio
          • DOW 5 Portfolio
  • Markets
        • US MARKET
          • Commodities
          • Energy
          • Precious Metals
          • Volatility
        • GLOBAL MARKETS
          • Market Indices
          • Economic Calendar
          • FOREX Heat Map
          • FOREX Cross Rates
          • Crypto Currency Market
  • Investing
    • Discord Community
    • Dashboard
  • Resources
        • ARTICLES
          • Dividend Growth Model Articles
          • ETF Articles
          • Investment Strategies Articles
          • Market and Economic Insights
          • Stock Trade Articles
          • Stock Reviews
        • TOOLS
          • Stock Scanners
          • Charting Software
          • Brokerage Firms
        • STOCK CHARTS
          • Key Components
          • Reading Charts
          • Drawing Stock Charts
          • Identifying Trends
        • RETIREMENT PLANNING
  • About
    • Contact Us
    • How to Win
    • #1 At Stockcharts
    • Disclaimer
    • FAQ
  • Log In
  • Subscribe

April 15, 2018

Green Line Weekly Apr 15, 2018

DIA Chart
The DOW must Break the Blue Down Trend Line.


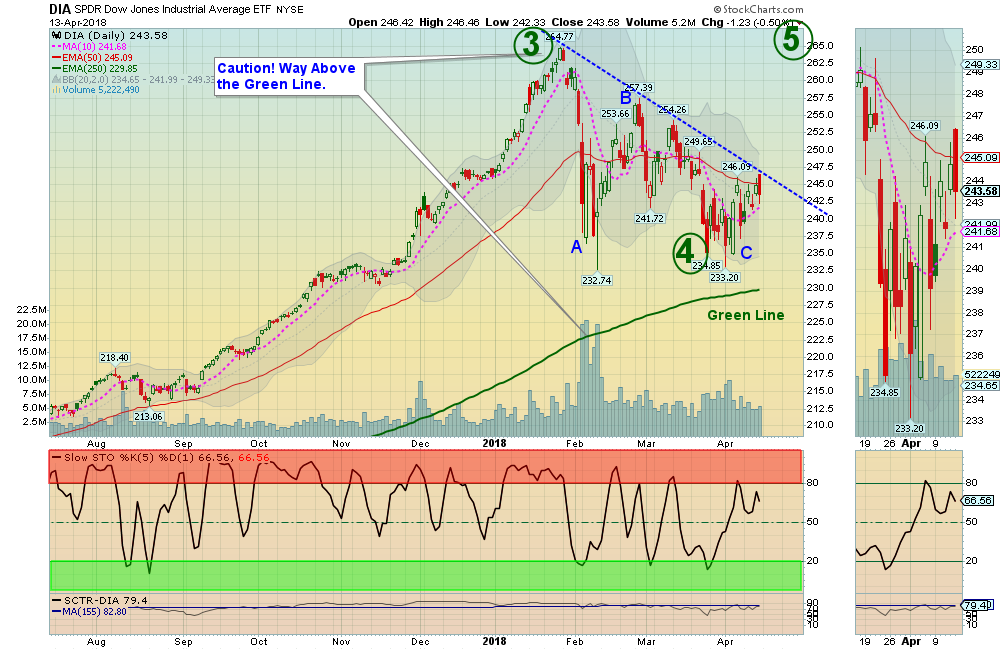
04/15/2018:  Markets were up 1 1/2 to 3% for the week, as the Indices rallied up again to the Red Lines (50-day avgs.)    This is very normal for the Markets to trade between the Red Lines and Green Lines, until one of the Lines is broken.

Earnings are starting to come out, so maybe the Indices will break the Down Trend lines soon and re-test the Jan Highs. Maybe another pull-back once more to make a Higher Low, which would convince most that the Selling is over.

Some of the Strongest Investments that held Above their Red Lines are  back up near the Highs. The Long Term Trend is UP.


Bonds are bearish (Below the Green Line and Low Relative Strength) but have rallied way back up to the Green Line (250-day avg.)

The Inflation Index (CRB) is staying above the 196.36 Break Out level, and now has resistance at 201.19. The US DOLLAR failed again the Red Line, and is re-testing the recent Lows.

Crude Oil was up 8.6% for the week at $67.40 and GOLD was up 0.66%.

___________________________________________________________________________________________

MONEY WAVE BUYS SOON:    We are currently in 12 logged Open Positions, for the Short & Medium Term. There are 2 Investments on the Short Term Watch List.  Be patient and WAIT for Green Zone Buys!

______________________________________________________________________________________________

LONG TERM TRADES 

The Funds below are currently out of favor and and recent news has cause more weakness. Some are having trouble with nice uptrends. But historically these could possibly Double or more from these lower levels. We are looking for a good Entry Point for these, but need the entire Economy  & Inflation to pick up speed:

DBC   COMMODITY FUND   Relative Strength is back Below 90.
KOL    COAL FUND        Relative Strength is back Below 90.
REMX   RARE EARTH FUND    Relative Strength is back Below 90.

___________________________________________________________________________________________

Click for  Portfolio (Open Positions)  
Click for  Watch List
Click for  Closed Positions


Alert! Market Risk is LOW (Green Zone). The probability of successful Short Term Trades is higher, when the S&P 500 is down near the Green Line. The Strongest Investments could re-test their Highs from these Over-Sold levels.


Tell your Friends about the Green Line, and Help Animals.


Related Post

– Green Line Weekly Apr 8, 2018

Subscribe to Our Newsletter

AGL Logo

Get our eBook Now!

Candlestick - A Swing Traders Friend

We don’t spam! Read our privacy policy for more info.

You’ve been successfully subscribed to our newsletter!

Voted #1 at Stock Charts

SH Chart
Inverse S&P 500 Fund (SH) will have a Money Wave Buy today.

Help Us Help Animals

Help Us Help Animals

Recent Comments

  • Market Breadth Indicators: A Trader’s Guide to Early Trend Detection on Backtesting: Definition and How a Trading Strategy Backtest Works
  • Island Reversal Pattern: Definition and Formation Explained on Double Top Pattern: How to Identify and Trade This Reversal Signal
  • Channel Pattern Guide: What It Is and Why It Matters on A Guide to Forecasting Using Moving Averages
  • What Is a Broadening Bottom Chart Pattern? Full Guide on Bull vs. Bear Market: An Investor’s Guide to Market Phases
  • ATGL Weekly Money Flow - 2025-05-11 on ATGL Top Pick of the Week! Apr 6, 2025

Become a Green Liner!

Help me make more Money in the Stock Market.

ON ATGL

  • DashBoard
  • Weekly Commentary
  • Daily Buy / Sell Signals
  • Day Trade Setup
  • Trading Rooms

Design & Develop By Pixelvect

STRATEGIES

  • Swing Trading
  • ATGL Pick of the Week
  • Dividend Growth
  • ETF Sector Rotation
  • Dogs of the Dow

HELP

  • ATGL Trading Rules
  • FAQ
  • Account Maintenance
  • Contact US
  • Join

FOLLOW US

Instagram Linkedin Twitter Facebook

© COPYRIGHT 2024 · ABOVETHEGREENLINE.COM · ALL RIGHTS RESERVED · PRIVACY · TERMS · CONTACT · WATCHLIST · CURRENT