
04/12/2020 HAPPY EASTER, and BE SAFE!
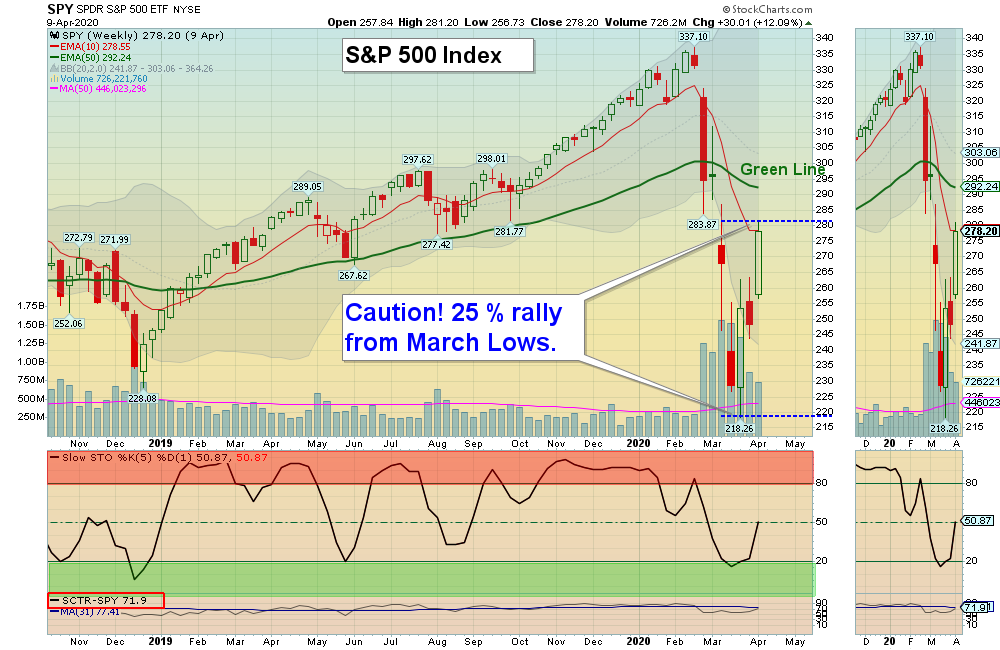
Markets were up Big for the week as the Indices rallied back up to the Red Lines (50-day avgs.). The Markets are no longer over-sold, and the strongest Leaders are back Above the Green Lines.
In a normal Market, we would expect the weaker Indices like the DOW 30 and the Small Caps to drop back down to re-test the March Lows. But with the FED promising to Print Trillions of Dollars to prop up the Economy, we will have to wait and see. Gold made a New High this week at $1753, so possibly the damage from the excess Printing could be Inflation. Bonds would not like Inflation, and would normally drop if Investors see Inflation coming.
Investments are now returning up near their Green Lines, The FEAR created an opportunity to Buy Investments that were on Sale, and we just saw a 20% + rally up from the Lows as the FEAR subsided.
The Green Line System captured more quick profits this week on Plug Power (PLUG + 15.06%), Ballard Power (BLDP +14.91% & + 5.07%), Small Cap Inverse Fund (RWM + 0.50%) & Gold Fund (IAU +8.77%).
The Green Line System is under water on other Investments, and the goal is to EXIT them soon as the Markets return up near their Green Lines (250-day avgs.) Or when the CNN Fear & Greed Index returns back up near 70. (Now at 43).
Finally the FEAR is subsiding, as human emotions are temporary. The Coronavirus appears to have peaked, or is peaking in most major countries other than France & the UK (from data provided by www.worldometers.info and assuming the data is accurate).
USA We went from a healthy country to a problem country, but hopefully we peaked on the 21st day of new cases and we are now leveling out before the decline begins. If the USA can follow the paths of other countries and have strict quarantines, then Covid 19 could be mostly over in 1-2 months.
It now looks like the Markets could be doing an A-B-C Correcting rally back up from very over sold levels. If you are worried about a Bear Market, the Green Line System has 2 Inverse Funds on the Watch List (VXX Volatility Index & RWM Inverse Small Cap Fund).
For the week the Dow was up 12.60%, the S&P 500 was up 12.09%, and the Nasdaq 100 was up 9.54%. The Long Term Trend for the Indices is mixed.
The Inflation Index (CRB) was down 0.11 % and is Below the Green Line, indicating Economic Weakness.
Bonds were down 1.85% for the week and are Above the Green Line, indicating Economic Weakness.
The US DOLLAR was down 1.25% for the week.
Crude Oil was down 19.65% for the week at $22.76 and GOLD was up 6.51% at $1752.80, a 1 year high.
_____________________________________________________________________________________________
MONEY WAVE BUYS SOON:
We are currently in 12 logged Open Positions, for the Short & Medium Term. There are 5 Investments on the Short Term Watch List.
Be patient and WAIT for Green Zone Buy Signals!
______________________________________________________________________________________________
LONG TERM INVESTMENTS (concentrating more on the Short Term now)
Buy the Leading Investments that are down near the weekly Green Zones.
ADBE ADOBE SYSTEMS INC. Buy when it Closes above $326.99 on High Volume.
KALA KALA PHARM. Buy when it Closes above $9.25 on High Volume.
______________________________________________________________________________________
Click for Portfolio (Open Positions)
Click for Watch List
Click for Closed Positions
NEW DIVIDEND GROWTH PORTFOLIO (please check it out)
ETF Sector Rotation System – New Quarterly Rotation was on Apr 1, 2020.
Long Term Strategy for IRAs & 401k Plans:
Alert! Market Risk is MEDIUM (Yellow Zone). The probability of successful Short Term Trades is better, when the % of stocks above the 50-day avg. is below 20.
Tell your Friends about the Green Line, and Help Animals
___________________________________________________________________________________________
4 Ways to Get your Daily Money Wave Alert:
- Emailed to your box between 3:30 3:50pm EDT.
- Website menu Commentary/Buy/Sell Signals
- Twitter notifications @AboveGreenLine
- Text messages: Email us your Cell number & phone carrier.