
By ATGL
Updated July 21, 2026
Golden cross trading centers on one of the most closely watched relationships in technical analysis: the moment a shorter-term moving average climbs above a longer-term one. Interpreted on its own, that event tells you a trend has already turned, but it says nothing about whether the move will hold.
Confirming the crossover raises the odds that the trend you’re entering will actually persist. This guide explains what a golden cross is, why it arrives late, and how disciplined traders separate a durable reversal from a false start.
For a wider grounding in how markets and trades function, our stock trading resources cover the fundamentals the golden cross builds on.
What Is a Golden Cross?
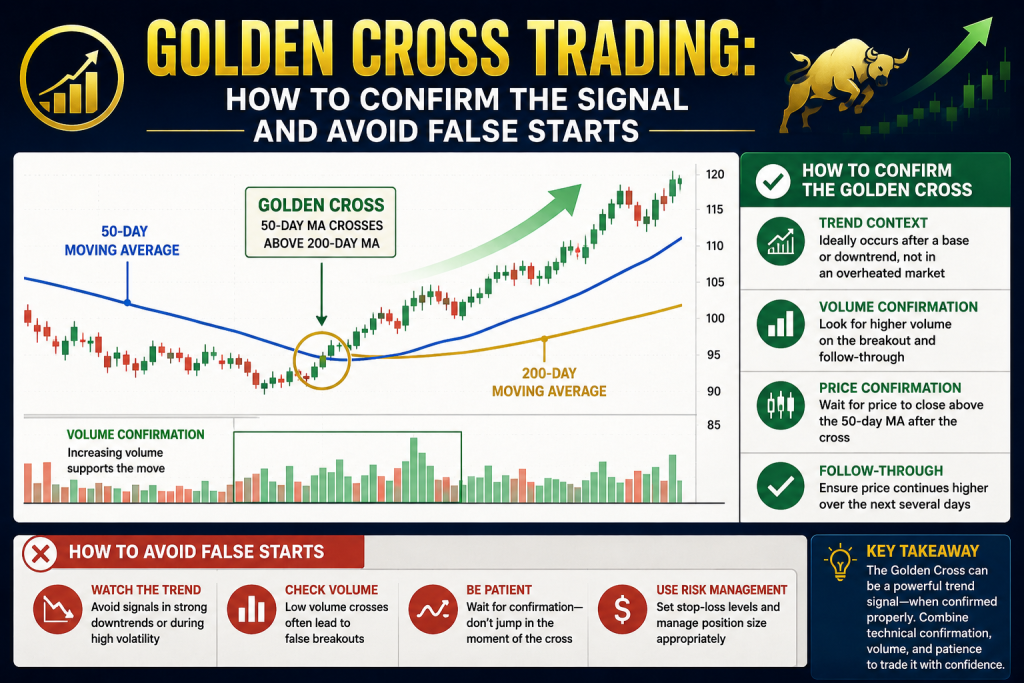
A golden cross forms when a security’s 50-day moving average, having been below its 200-day moving average, crosses up through it. The two lines track different horizons: the 50-day reflects recent price behavior, while the 200-day represents the longer-term direction. When the faster average moves above the slower one, it signals that near-term momentum has turned upward relative to the established trend.
Each line comes from a simple calculation. The 50-day version averages the most recent 50 closes:
50-day SMA = (sum of the last 50 daily closing prices) / 50
Applying the same method across 200 sessions produces the slower average, so the golden cross ultimately measures how short-term price movement compares with the long-term trend.
The crossover itself is a single moment, but the golden cross is best read as a three-stage sequence:
- Preceding downtrend: Sustained selling keeps the 50-day average below the 200-day, reflecting a market still trending down.
- Crossover: The 50-day average crosses up through the 200-day—the point that gives the pattern its name.
- Confirmation: Both averages turn higher, and the price holds above them, providing trend confirmation.
The death cross is the bearish counterpart, forming when the 50-day average instead falls below the 200-day. Reading the golden cross vs. death cross signals together helps you interpret both ends of a trend cycle; our explainer on what is a death cross in stocks covers the downside case.
Why the Golden Cross Lags Price
Because moving averages summarize past closes, the golden cross is a lagging indicator by design. It reports a trend already in motion rather than forecasting one.
This lag cuts both ways: it filters short-term noise and keeps you from reacting to every minor swing, but it also means part of the advance has already passed by the time the crossover appears.
Traders accept later entries in exchange for a cleaner view of direction, which is why the pattern suits position-oriented approaches more than rapid, short-hold tactics.
How to Confirm a Golden Cross
A crossover alone is information, not a mandate to buy. Confirmation strengthens the case that the shift will persist, and experienced traders weigh several checks together:
- Volume behavior: Rising participation on and after the crossover points to conviction behind the move, while thin volume weakens the reading. Our guidance on volume analysis details how to measure this.
- Relative strength: A security outpacing its sector or the broader market as the cross forms indicates leadership rather than a passive drift higher.
- Price position: Price remaining above both averages, rather than slipping beneath them, supports the reversal.
- Persistence: A crossover that holds across several sessions carries more weight than one that reverses within days.
- Underlying quality: A cross on a fundamentally sound name—judged through balance sheet strength, index membership, or a place among the dividend aristocrats—aligns technical and fundamental evidence.
Moving-average signals like this have a long research history. The influential study by Brock, Lakonishok, and LeBaron found that simple moving-average rules had measurable predictive value in decades of market data.
Spotting False Starts and Whipsaws
False crossovers cluster in range-bound, choppy markets. When a price oscillates without clear direction, the 50-day and 200-day averages sit close together and can cross back and forth, producing a whipsaw that puts traders on the wrong side of the position.
On a chart, a failed golden cross often shows the faster average edging above the slower one, then turning back down within a few sessions as the price fails to follow through. The same caution behind false breakout trading—demanding follow-through before acting—applies directly to crossovers.
Entry Approaches After the Signal
Buying the moment a golden cross forms is rarely the strongest choice. Three entry approaches are common, each with a distinct trade-off between how early you commit and how much confirmation you require.
Acting immediately on the crossover captures the earliest position but exposes you to a whipsaw if the move fails. Waiting for confirmation—several sessions of price holding above both averages, ideally on rising volume—gives up some of the early upside in return for a higher-probability entry.
Entering on a retest, when the price pulls back toward the 50-day average and finds support before resuming, offers a defined risk point, though it may never arrive if the trend runs without pausing. No single option is correct on its own; the right one depends on your risk tolerance and holding period.
The Golden Cross in Major Indexes
At the index level, the golden cross draws particular attention because broad-market reversals tend to unfold over long horizons. The historical record supports that interest without promising an outcome: using S&P 500 data back to 1928, Bank of America found the index higher about two-thirds of the time in the roughly 260 trading days after a golden cross, averaging a gain near 9%—and stronger still when the signal formed during a recession.
The July 2020 crossover shows the bullish case in action. Days after the pandemic-driven bottom, the 50-day average moved above the 200-day, and the S&P 500 went on to climb for roughly 18 months, peaking in early 2022. A two-thirds tendency, though, is not a promise. The remaining cases produced shallow gains or quick reversals, so a single occurrence is context rather than a guarantee.
Making the Golden Cross Part of a Systematic Strategy
Golden cross trading works best when the crossover is treated as one signal to weigh against others—volume, relative strength, and the market backdrop—rather than a standalone reason to buy.
A repeatable framework evaluates several factors at once: the durability of the crossover, confirmation from volume, the security’s relative strength, and the fit with the broader market conditions. Working through the same criteria on every setup removes guesswork and emotion from the decision. That consistency is the basis of a reliable moving average crossover strategy and disciplined trend following.
At Above the Green Line, our systematic model applies these principles across relative strength, moving averages, and volume to identify and monitor candidates, with annotated charts marking potential buy and sell points. To put a rules-based approach to work on your own portfolio, explore our membership options.