Above the Green Line -01
  • Market Insights
        • Commentary
          • Daily
          • Weekly
        • BUY / SELL SIGNALS
          • Trade Posts
          • Recent Trade Alerts
          • Recent Day Trades
        • BLOGROLL
          • Dividend Growth Blog
          • ETF Sector Blog
          • Dow Dogs
          • TPOW Blog
  • Strategies
        • SWING TRADING
          • Current Positions
          • Watchlists
          • Closed Positions
          • Candidates - TOP 100
          • Specialty Stocks
        • WEEKLY STOCK PICK
          • TPOW Charts
          • TPOW Performance
          • TPOW Strategy Guide
          • TPOW Performance Dashboard
          • Why Weekly Trading Works
        • DAY TRADING
          • Watch List
        • ATGL DASHBOARD
        • ETF STRATEGIES
          • ETF Sector Rotation
          • ETF Sector Portfolio
        • DIVIDEND GROWTH
          • Dividend Growth Portfolio
          • Dividend Calendar
        • DOGS OF THE DOW
          • Dogs of the Dow Portfolio
          • DOW 5 Portfolio
  • Markets
        • US MARKET
          • Commodities
          • Energy
          • Precious Metals
          • Volatility
        • GLOBAL MARKETS
          • Market Indices
          • Economic Calendar
          • FOREX Heat Map
          • FOREX Cross Rates
          • Crypto Currency Market
  • Investing
    • Discord Community
    • Dashboard
  • Resources
        • INVESTING GUIDES
          • Dividend Growth Guide
          • Investment Strategy Framework
          • ETF Investing Handbook
          • Stock Trading Handbook
        • ARTICLES
          • Dividend Growth Model Articles
          • ETF Articles
          • Investment Strategies Articles
          • Market and Economic Insights
          • Stock Trade Articles
          • Stock Reviews
        • TOOLS
          • Stock Scanners
          • Charting Software
          • Brokerage Firms
          • Stocks We Review
        • STOCK CHARTS
          • Key Components
          • Reading Charts
          • Drawing Stock Charts
          • Identifying Trends
  • About
    • Contact Us
    • How to Win
    • #1 At Stockcharts
    • Disclaimer
    • FAQ
  • Log In
  • Subscribe

August 12, 2020

Dow 30

Dow 30

Source

What is the Dow 30?

The Dow 30, also known as the Dow Jones Industrial Average (DIJA), is an index that was developed in 1896 to track the overall health of the stock market. Founded by Charles Dow and his business partner Edward Jones, the Dow 30 made waves by establishing itself as one of the first indices to track market health during an era of limited information. The Dow’s long history of success has made it a benchmark for many investors. So much so that when reporters refer to the market as “being up today”, they mean that the Dow is up.

How Does the Dow 30 Work?

In its early stages, the DIJA consisted of 12 companies that were considered impactful to the United States’ economy. Today, the Dow 30 works by combining the price of the 30 largest publicly traded companies and dividing the sum by a certain number. The Dow Divisor changes every now and then depending on stock splits and stock dividends. Thus, the Dow 30 provides an analysis of overall market health while simultaneously accounting for changes. Furthermore, the Dow 30 regularly makes changes to the composition of the index when companies become less relevant or do not reflect the current trends of the economy. The weight each company has within the index depends on its share price. Stocks with higher share prices will have a larger weight within the index and thus have a greater capacity to change the index’s value. If investors so choose, they can purchase shares of the Dow which would allow them access to all 30 companies listed within the index.

Companies Within the Dow 30

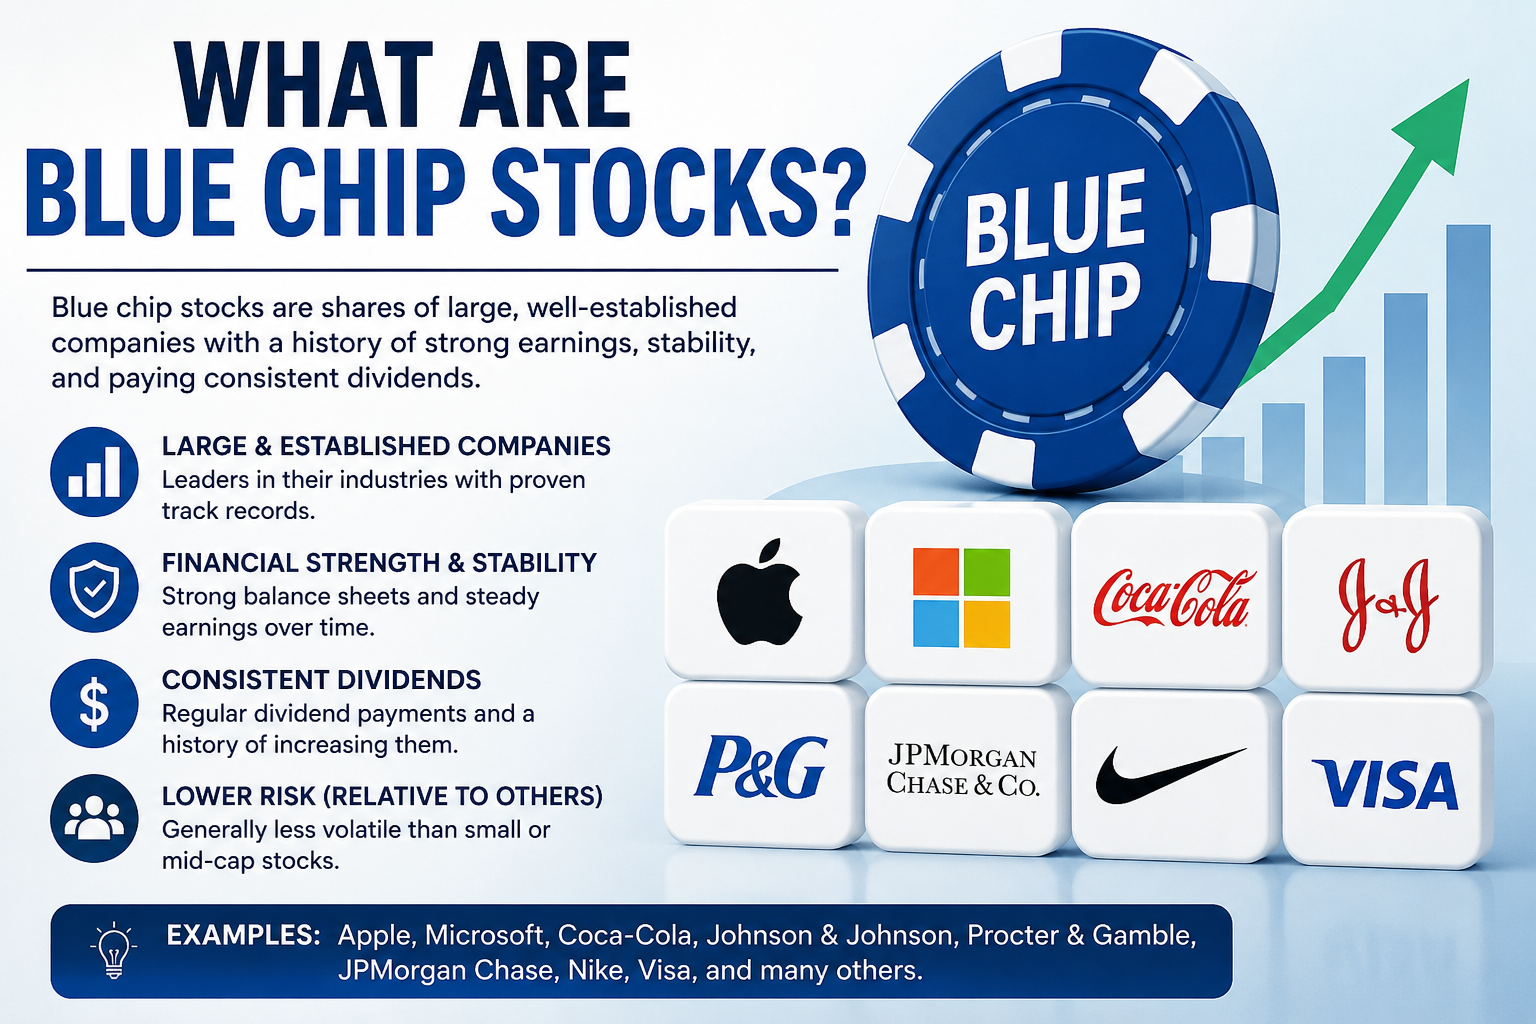
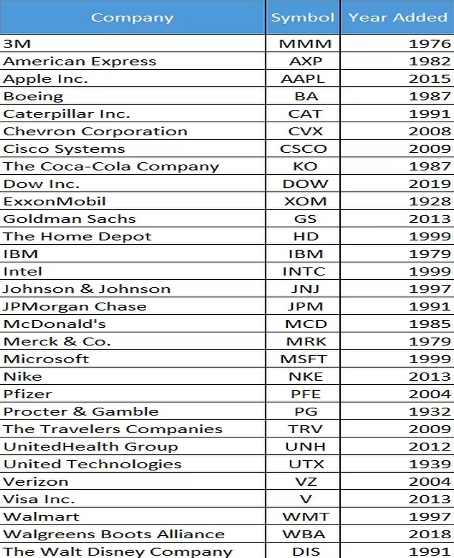
The Dow 30 includes a variety of corporations; however, they can all be generally described as “blue-chip companies”. Blue-chip companies tend to have national reputations for quality, stability, and profitability. As previously mentioned, depending on the economic condition, companies are regularly taken out and added by a committee that has employees from The Wall Street Journal and the S&P Dow Jones Indices. The list of corporations within the Dow 30 has changed 60 times since 1928. Below is an alphabetical list of companies within the index as of May 2020.

Source

Risk of the Dow 30

There are a number of critics who believe that the Dow 30 does not fully represent the condition of the U.S. economy as it only contains 30 corporations. Critics believe the composition of the index is too small and thus fails to consider companies of different sizes and industries. These critics tend to favor the S&P 500 as they believe it has a more comprehensive list of companies that can better understand the state of the market. Additionally, the S&P 500 tracks and factors in market capitalization. Market capitalization is calculated by multiplying the number of outstanding shares times the market price. The Dow 30 does not represent the market capitalization of its companies. As such, critics tend to also believe that simply accounting for share price does not provide an accurate examination of market health and tend to favor indices that utilize market capitalization.

Conclusion

The Dow 30 is a landmark index that has been around for over a century. It has reached many historical milestones from its foundation in a limited information era to large percentage gains. The Dow 30 has long functioned as a way for investors and economic analysts to gauge the overall health of the market. While it does not contain nearly as many corporations as the S&P 500, there is something to be said for its great historical success and ability to advance for so many years.


Related Articles

XBI ETF

XBI ETF Explained: Is This Biotech Fund a Smart Buy in 2026?

What Is the XBI ETF? The SPDR S&P Biotech ETF (XBI) is an exchange-traded fund designed to track the performance ...
Read More
Net Present Value - Dividend Stocks

How to Use Net Present Value (NPV) for Dividend Stocks

Dividend investors often focus on yield, payout ratios, and dividend growth streaks. Those metrics matter. But they don’t answer the ...
Read More
Free Cash Flow

Free Cash Flow: The Ultimate Guide to Financial Strength and Dividend Sustainability

Free Cash Flow (FCF) is one of the most important financial concepts an investor can understand, yet it is also ...
Read More
DRIP - Dividend Reinvestment Plan

Dividend Reinvestment Plan (DRIP): How Automatic Reinvestment Builds Long-Term Wealth

Building Wealth Through Automatic Compounding A Dividend Reinvestment Plan—commonly referred to as a DRIP—is one of the most powerful yet ...
Read More
Reinvestment Strategy

Reinvestment Strategy: Turning Income into Compounding Wealth

The Decision That Shapes Long-Term Outcomes Every investor eventually reaches a recurring decision point: what should be done with incoming ...
Read More
Dividend Growth vs High Yield

Dividend Growth vs High Yield: Choosing the Right Income Strategy for Long-Term Investors

Income investing often begins with a simple question: How can I generate reliable cash flow from my portfolio? Yet beneath ...
Read More

Subscribe to Our Newsletter

AGL Logo

Get our eBook Now!

Candlestick - A Swing Traders Friend

We don’t spam! Read our privacy policy for more info.

You’ve been successfully subscribed to our newsletter!

Voted #1 at Stock Charts

SH Chart
Inverse S&P 500 Fund (SH) will have a Money Wave Buy today.

Help Us Help Animals

Help Us Help Animals

Recent Comments

  • How to Use Net Present Value (NPV) for Dividend Stocks on How To Analyze Stocks With the Dividend Discount Model
  • How to Use Net Present Value (NPV) for Dividend Stocks on How To Develop an Effective Dividend Investing Strategy
  • How to Use Net Present Value (NPV) for Dividend Stocks on Why Is Time Value of Money Important for Investors
  • Free Cash Flow (FCF) Guide: Dividend Safety & Financial Strength on Dividend Payout Ratio: Definition, Formula, and Calculations
  • Dividend Payout Ratio: Definition, Formula, and Calculations on How To Analyze Stocks With the Dividend Discount Model

Become a Green Liner!

Help me make more Money in the Stock Market.

ON ATGL

  • DashBoard
  • Weekly Commentary
  • Daily Buy / Sell Signals
  • Day Trade Setup
  • Trading Rooms

Design & Develop By Pixelvect

STRATEGIES

  • Swing Trading
  • ATGL Pick of the Week
  • Dividend Growth
  • ETF Sector Rotation
  • Dogs of the Dow

HELP

  • ATGL Trading Rules
  • FAQ
  • Account Maintenance
  • Contact US
  • Join

FOLLOW US

Instagram Linkedin Twitter Facebook

© COPYRIGHT 2024 · ABOVETHEGREENLINE.COM · ALL RIGHTS RESERVED · PRIVACY · TERMS · CONTACT · WATCHLIST · CURRENT