By ATGL
Updated October 22, 2024
The cost of equity represents a crucial component in financial decision-making, providing insights into the returns shareholders expect for their investment in a company. Understanding this concept is vital for investors, financial analysts, and corporate decision-makers alike. This comprehensive guide delves into the definition, calculation methods, and practical applications of the cost of equity.
What Is Cost of Equity?
Cost of equity refers to the rate of return a company must offer investors to compensate them for the risk of investing in its shares. It reflects the opportunity cost for shareholders, representing the return they could earn by investing in alternative assets with similar risk profiles. A company’s return on equity (ROE), which measures its profitability relative to shareholders’ equity, should ideally exceed the cost of equity to create value for its investors.
This metric plays a pivotal role in various financial contexts:
- Valuation: Serves as a key input in discounted cash flow (DCF) models, helping determine a company’s fair value.
- Capital Budgeting: Cost of equity influences decisions about which projects a company should undertake.
- Performance Evaluation: It provides a benchmark against which a company’s actual returns can be measured.
Importance of Cost of Equity in Financial Decision-Making
Implications for Shareholder Expectations
The cost of equity directly reflects shareholder expectations. A higher cost of equity indicates investors perceive greater risk associated with the company, demanding higher returns to compensate for this risk. Conversely, a lower cost of equity suggests investors view the company as relatively stable and less risky.
Role in Capital Budgeting
In capital budgeting, the cost of equity serves as a hurdle rate for potential projects. Projects with expected returns exceeding the cost of equity are typically considered value-creating and are more likely to be approved. This approach helps companies allocate resources efficiently and maximize shareholder value.
Impact on Business Valuation
Cost of equity significantly influences business valuation. It forms a critical component of the weighted average cost of capital (WACC), commonly used as the discount rate in DCF models. A higher cost of equity leads to a lower present value of future cash flows, potentially resulting in a lower valuation for the company.
Key Methodologies for Calculating Cost of Equity
Capital Asset Pricing Model (CAPM)
The CAPM is widely used to calculate the cost of equity. The formula is:
Cost of Equity = Risk-Free Rate + Beta * (Market Return – Risk-Free Rate)
Where:
- Risk-Free Rate: Typically the yield on government bonds
- Beta: Measure of the stock’s volatility relative to the market
- Market Return: Expected return of the overall market
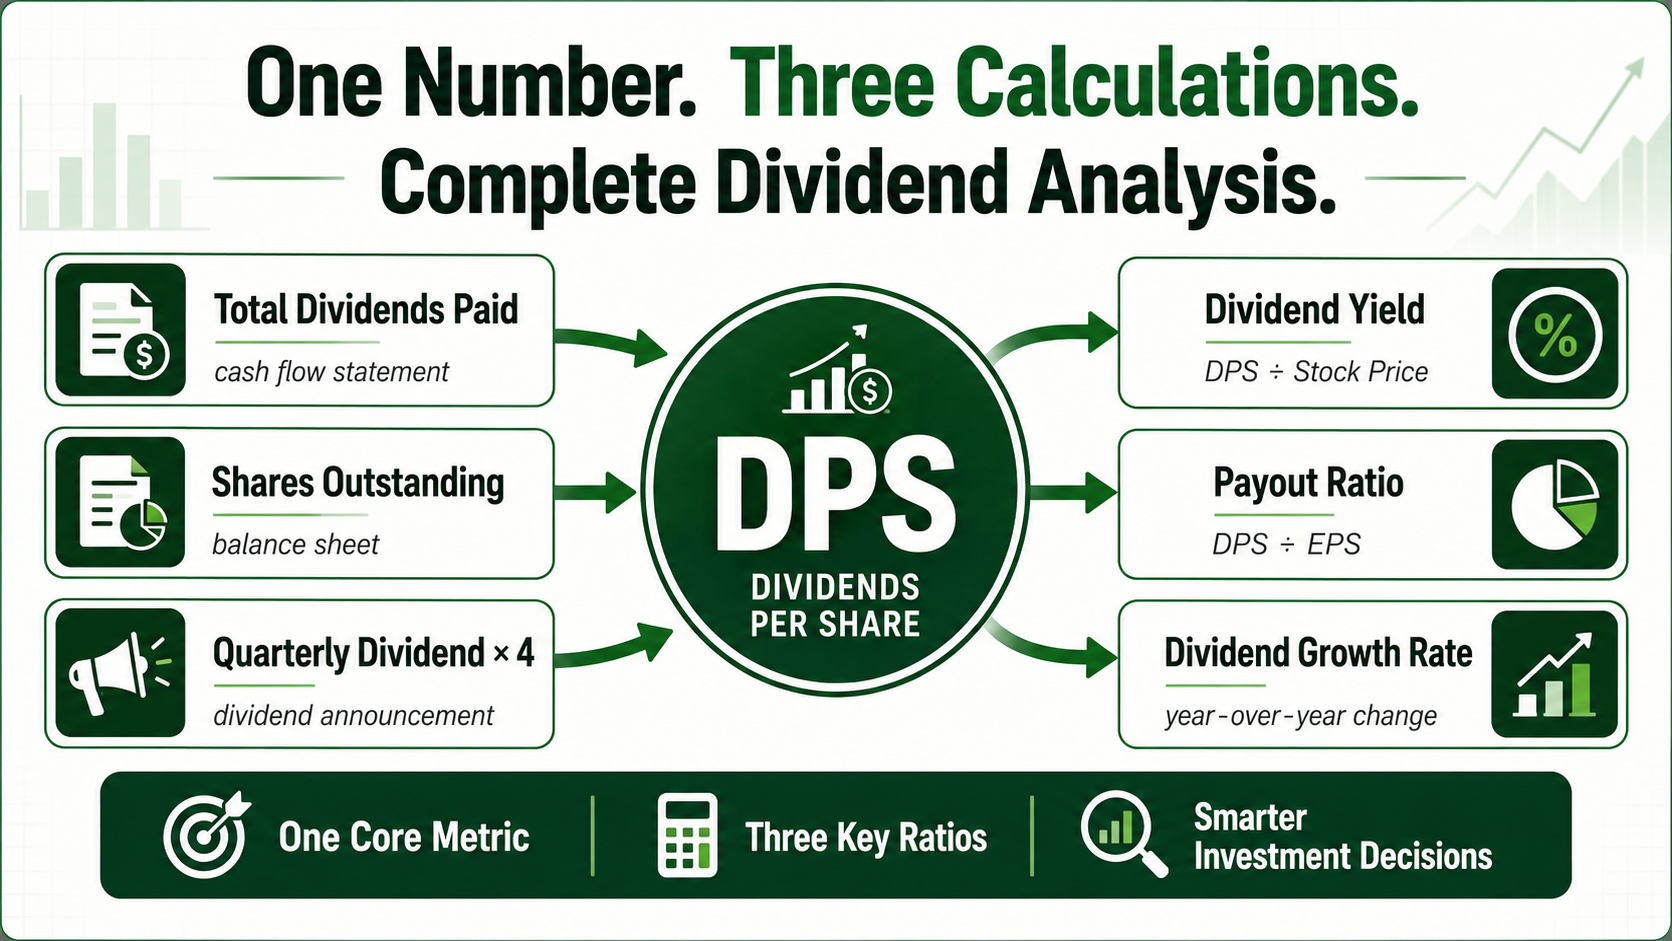
Dividend Capitalization Model
For dividend-paying stocks, the Dividend Capitalization Model (also known as the Gordon Growth Model) can be employed:
Cost of Equity = (Dividend per Share / Current Stock Price) + Dividend Growth Rate
This model assumes a constant growth rate of dividends.
Real-World Examples of Cost of Equity Calculations
Understanding how to calculate the cost of equity is crucial for investors and financial analysts. Let’s explore two hypothetical examples using different methodologies to illustrate how this concept applies in various scenarios.
Example Using CAPM
Consider a hypothetical high-growth technology company:
- Risk-Free Rate: 2.5% (based on 10-year U.S. Treasury yield)
- Beta: 1.4 (indicating higher volatility than the market)
- Market Return: 9% (based on historical S&P 500 returns)
Cost of Equity = 2.5% + 1.4 * (9% – 2.5%) = 11.6%
This 11.6% cost of equity suggests investors in this hypothetical tech company expect a relatively high return, reflecting the higher risk profile typical in the dynamic tech sector. The company must generate returns above this threshold to create shareholder value.
Example Using Dividend Capitalization Model
Now, let’s examine a hypothetical well-established utility company:
- Current Stock Price: $75
- Annual Dividend: $3.30
- Expected Dividend Growth Rate: 2.5% (based on historical dividend growth and industry outlook)
Cost of Equity = ($3.30 / $75) + 2.5% = 6.9%
The utility company’s 6.9% cost of equity is notably lower than the tech company’s, reflecting the utility sector’s relative stability and lower risk. This lower cost of equity allows the utility company to undertake projects with lower expected returns while still creating value for shareholders.
Implications of These Examples
These examples illustrate how industry characteristics and company-specific factors influence the cost of equity. The tech company’s higher cost of equity might push it to pursue more aggressive growth strategies to meet investor expectations. In contrast, the utility company can focus on steady, reliable returns, aligning with its investors’ more conservative expectations.
Understanding these nuances is critical for investors when evaluating potential investments across different sectors. It’s equally essential for company management to make strategic decisions about capital allocation and project selection. By comparing the cost of equity across various industries, investors can gauge the risk-return tradeoffs and align their investment choices with their risk tolerance and financial goals.
Factors Influencing Cost of Equity
Several factors can impact a company’s cost of equity:
- Market Conditions: Overall economic conditions and market volatility affect perceived risk.
- Industry Risk: Some industries are inherently riskier than others.
- Company-Specific Factors: Financial leverage, management quality, and growth prospects influence individual company risk.
- Regulatory Environment: Changes in regulations can affect a company’s risk profile.
Common Pitfalls in Calculating Cost of Equity
While calculating cost of equity, be mindful of these potential pitfalls:
- Inappropriate Beta: Using a beta that doesn’t accurately reflect the company’s risk can skew results.
- Incorrect Market Risk Premium: The difference between market return and risk-free rate should be carefully estimated.
- Overlooking Company-Specific Risks: Factors unique to the company should be considered.
- Misapplying Models: Using the wrong model for a given situation can lead to inaccurate results.
Comparing Cost of Equity With Cost of Debt
Cost of equity typically exceeds the cost of debt for several reasons:
- Risk: Equity investors bear more risk than debt holders and thus demand higher returns.
- Tax Treatment: Interest payments on debt are tax-deductible, while dividend payments are not.
- Claim on Assets: In case of bankruptcy, debt holders have a higher claim on company assets than equity holders.
Understanding the relationship between cost of equity and cost of debt is crucial for optimal capital structure decisions.
Ensure Sound Investment Decisions With Above the Green Line
Grasping the nuances of cost of equity is essential for making informed investment decisions. It forms a cornerstone of financial analysis, influencing everything from factor investing strategies to determining the fair value of stock.
At Above the Green Line, we provide tools and insights to help you navigate these complex financial concepts. Our comprehensive resources can assist you in calculating and interpreting cost of equity, enabling you to make more informed investment decisions. To learn more about how we can support your financial journey, explore our membership options.
By understanding and accurately calculating the cost of equity, you’ll be better equipped to evaluate investment opportunities, assess company performance, and optimize your portfolio for long-term success.

Related Articles
[pt_view id=”b47aec5l7b”]