Above the Green Line -01
  • Market Insights
        • Commentary
          • Daily
          • Weekly
        • BUY / SELL SIGNALS
          • Trade Posts
          • Recent Trade Alerts
          • Recent Day Trades
        • BLOGROLL
          • Dividend Growth Blog
          • ETF Sector Blog
          • Dow Dogs
          • TPOW Blog
  • Strategies
        • SWING TRADING
          • Current Positions
          • Watchlists
          • Closed Positions
          • Candidates - TOP 100
          • Specialty Stocks
        • WEEKLY STOCK PICK
          • TPOW Charts
          • TPOW Performance
          • TPOW Strategy Guide
          • TPOW Performance Dashboard
        • DAY TRADING
          • Watch List
        • ATGL DASHBOARD
        • ETF STRATEGIES
          • ETF Sector Rotation
          • ETF Sector Portfolio
        • DIVIDEND GROWTH
          • Dividend Growth Portfolio
          • Dividend Calendar
        • DOGS OF THE DOW
          • Dogs of the Dow Portfolio
          • DOW 5 Portfolio
  • Markets
        • US MARKET
          • Commodities
          • Energy
          • Precious Metals
          • Volatility
        • GLOBAL MARKETS
          • Market Indices
          • Economic Calendar
          • FOREX Heat Map
          • FOREX Cross Rates
          • Crypto Currency Market
  • Investing
    • Discord Community
    • Dashboard
  • Resources
        • ARTICLES
          • Dividend Growth Model Articles
          • ETF Articles
          • Investment Strategies Articles
          • Market and Economic Insights
          • Stock Trade Articles
          • Stock Reviews
        • TOOLS
          • Stock Scanners
          • Charting Software
          • Brokerage Firms
        • STOCK CHARTS
          • Key Components
          • Reading Charts
          • Drawing Stock Charts
          • Identifying Trends
        • RETIREMENT PLANNING
  • About
    • Contact Us
    • How to Win
    • #1 At Stockcharts
    • Disclaimer
    • FAQ
  • Log In
  • Subscribe

February 23, 2020

Community Health Systems (CYH) – Long Term Buy soon

COMMUNITY HEALTH SYSTEMS (CYH)


Company Profile

Community Health Systems, Inc. engages in the management and operations of hospitals. It operates general acute care hospitals and related healthcare entities that provide inpatient and outpatient healthcare services. The company was founded in March 1985 and is headquartered in Franklin, TN.

CYH Chart
Wait for Community Health to return back to the Green Zone for Money Wave Buy.

What Happened?

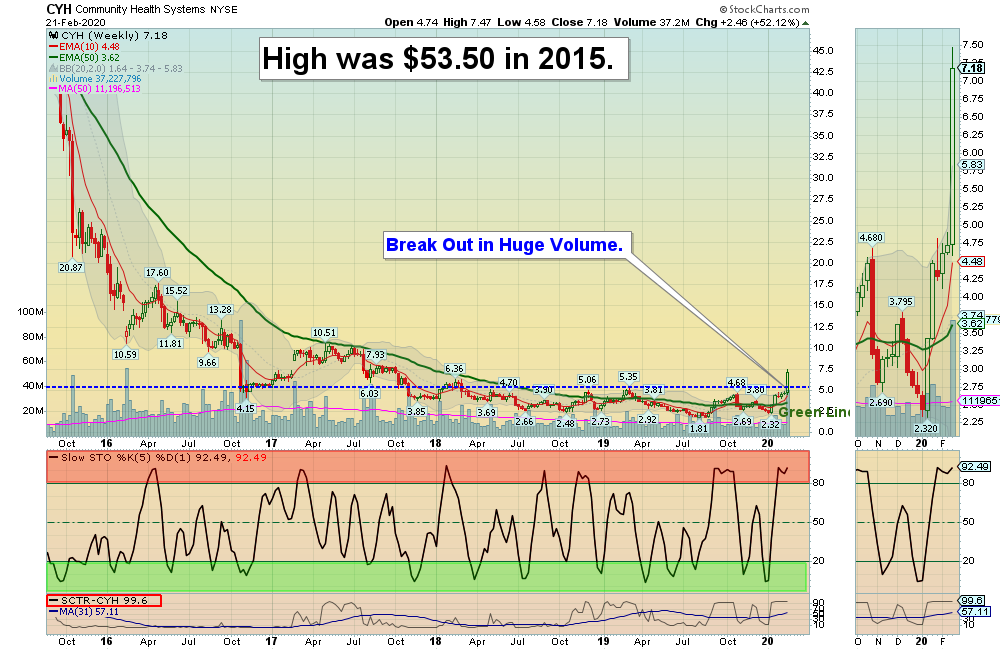
Over half a decade Community Health Systems reduced its trailing twelve month revenue by 9.2% for each year. That’s definitely a weaker result than most pre-profit companies report. So it’s not that strange that the share price dropped 32% per year in that period. The stock price dropped from a High of $53.50 to $1.79.

However, recently shares of CYH made new 52-week Highs on Thursday Feb. 21, 2020 after the company posted adjusted earnings per share of $0.40, well above the average analysts’ estimate of an adjusted net loss of $0.46 per share in Q4.

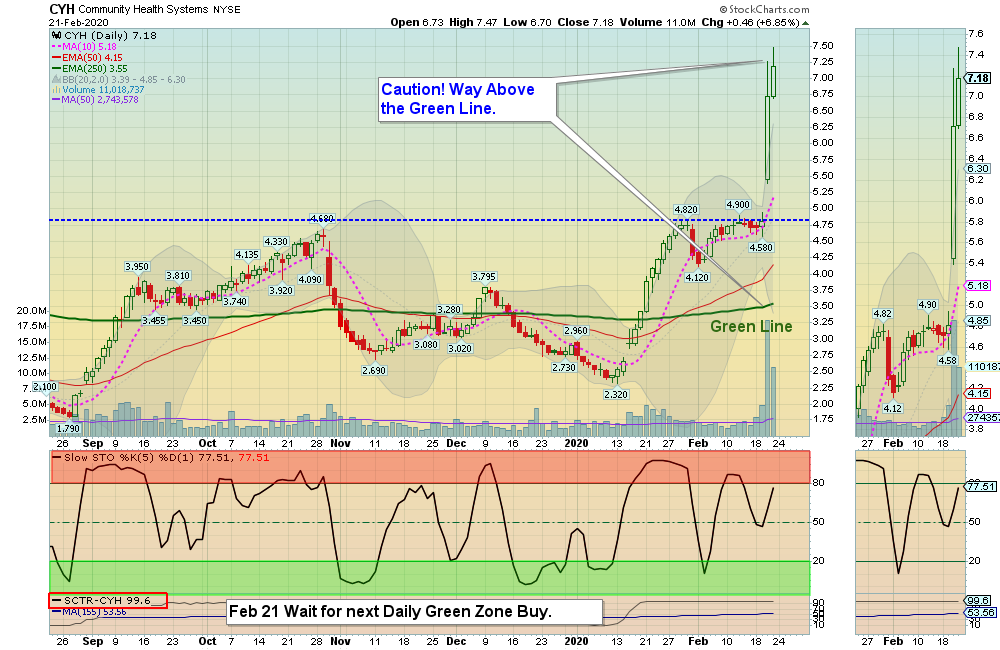
This has caused a technical Break Out on the stock above $4.90. which now should become Support. This could also mean that many Investors agree that the Company will no longer go broke. It could also be acquired before reaching the All Time High of $53.50.   As a result, its Relative Strength as evidence in the daily chart is now 99.

When to Buy?

CYH is currently Way Above the Green Line. We will wait to Buy when CYH returns to the Green Zone for a Daily Money Wave Buy Signal.

Objective

Above the Green Line is watching CYH for a long term investment. Mutual Funds paid $53.50 for CYH in 2015, and is now on Sale. Target is $20.00, if it can hold above the $4.90 Support. Wait to Buy on the Next Daily Green Zone Buy Signal.

CYH Chart
Nice Break Out on Community Health (CYH).

Follow the Rules: Above the Green Line + Above 90 Relative Strength

Join Now
Become a Green Liner!

Daily Investment Commentary


Subscribe to Our Newsletter

AGL Logo

Get our eBook Now!

Candlestick - A Swing Traders Friend

We don’t spam! Read our privacy policy for more info.

You’ve been successfully subscribed to our newsletter!

Voted #1 at Stock Charts

SH Chart
Inverse S&P 500 Fund (SH) will have a Money Wave Buy today.

Help Us Help Animals

Help Us Help Animals

Recent Comments

  • Want to Protect Your Capital? Start With Better Position Sizing on Risk Management in Trading: Tools and Techniques
  • Want to Protect Your Capital? Start With Better Position Sizing on Swing Trading Risk Management: Tips To Safeguard Your Profits
  • Price Action Trading Strategies That Work in Any Market on What Is a Death Cross in Stocks? A Bearish Market Signal
  • ATGL Weekly Money Flow - 2025-07-13 on AGTL Top Pick of the Week! May 11, 2025
  • Market Breadth Indicators: A Trader’s Guide to Early Trend Detection on Backtesting: Definition and How a Trading Strategy Backtest Works

Become a Green Liner!

Help me make more Money in the Stock Market.

ON ATGL

  • DashBoard
  • Weekly Commentary
  • Daily Buy / Sell Signals
  • Day Trade Setup
  • Trading Rooms

Design & Develop By Pixelvect

STRATEGIES

  • Swing Trading
  • ATGL Pick of the Week
  • Dividend Growth
  • ETF Sector Rotation
  • Dogs of the Dow

HELP

  • ATGL Trading Rules
  • FAQ
  • Account Maintenance
  • Contact US
  • Join

FOLLOW US

Instagram Linkedin Twitter Facebook

© COPYRIGHT 2024 · ABOVETHEGREENLINE.COM · ALL RIGHTS RESERVED · PRIVACY · TERMS · CONTACT · WATCHLIST · CURRENT