
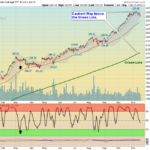
Markets are down again, as the Leaders are slowly returning to their Green Zones for Buy Signals soon. The Tech Stocks and the DOW are currently the Strongest Indices to Buy soon. Be patient and WAIT for the Leaders to return to their … [Read more...]
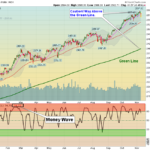
Money Wave Alert! Nov 14, 2017
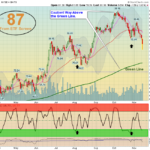
Markets are down today, but have recovered well off the morning lows. The Leading Tech Stocks and the DOW are holding up the Markets, and should re-test last week's Highs. Be patient and WAIT for the Leaders to return back down to … [Read more...]
Money Wave Alert! Nov 13, 2017
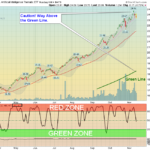
Markets are up slightly today, as the Leading Tech Stocks are going up to re-test last week's Highs. The S&P 500 is struggling at the Pink Line (10-day avg.) of 2586. Be patient and WAIT for the Leaders to return back down to … [Read more...]
Money Wave Alert! Nov 10, 2017
Markets are mixed today, and the S&P 500 was able to rally last night to stay above the Pink Line (10-day avg.) of 2584. The Leading Tech Stocks were able to bounce off the Pink Line, and should re-test the Highs soon. Be patient … [Read more...]
Money Wave Alert! Nov 9, 2017
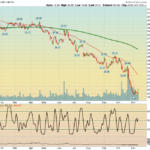
Markets are down today, as the S&P 500 broke below the Pink Line (10-day avg.) of 2583 to create a Short Term Sell Signal. The Leading Tech Stocks were able to bounce off the Pink Line today, and should re-test the Highs soon. Be … [Read more...]
- « Previous Page
- 1
- …
- 427
- 428
- 429
- 430
- 431
- …
- 491
- Next Page »