
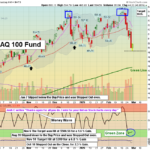
2/28/2025 The Markets were mostly higher today, as the Leaders and Techs finally had some Buyers come in. NVIDIA & Tesla stock prices bounced up after big drops. Stocks have been down sharply on profit taking and a big FEAR Flush. The Leading … [Read more...]
Money Wave Alert! Feb 28, 2025
Money Wave Alert! Feb 27, 2025
2/27/2025 The Markets were sharlpy lower again today, as the Leaders and Techs dropped on weaker NVIDIA stock price (-7 %). Stocks have been down sharply on profit taking and a big FEAR Flush. Many high momentum stocks are … [Read more...]
Money Wave Alert! Feb 26, 2025
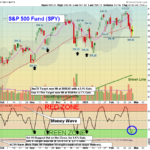
2/26/2025 The Markets were slightly lower again today, but several of the Leaders and Techs finally bounced up. There were 5 Swing Trade Buys today (please see below). Stocks have been down sharply on profit taking and a big FEAR Flush. Many high … [Read more...]
Money Wave Alert! Feb 25, 2025
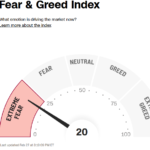
2/25/2025 The Markets were mostly lower today, but some of the Techs were down sharply on profit taking and a big FEAR Flush. There are now 9 stocks on the Watch List below. Many high momentum stocks have finally come down to the Green Zones for Buy … [Read more...]
Money Wave Alert! Feb 24, 2025
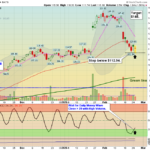
The TOP Pick of the Week: Ark Innovation Fund $ARKK was bought on the Open today, and will be Sold on the Close on Friday. 2/24/2025 The Markets were mixed to lower today, after Friday's drop. Many high momentum stocks have finally come … [Read more...]
- « Previous Page
- 1
- …
- 56
- 57
- 58
- 59
- 60
- …
- 491
- Next Page »