
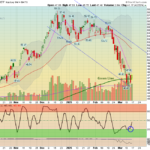
The Top Pick of the Week: Magnificent 7 Fund (MAGS) will be Sold on the Close today after a wild week. March 14, 2025 Today the Nasdaq was sharply higher with decent bullish momentum. The upside Buying was strong but the Volume was not high or … [Read more...]
Money Wave Alert! Mar 14, 2025
Money Wave Alert! Mar 13, 2025

March 13, 2025 Today, the Nasdaq remained in a weak trend, showing no strong buying momentum but holding key levels. Overall, the market is still in a cautious phase, with mixed sentiment and low conviction. SPY is sitting in the daily green zone, … [Read more...]
Money Wave Alert! Mar 12, 2025

March 12, 2025, the Nasdaq market is beginning to show mild buying today on some Short covering. SPY remains at the Green Line on the daily chart, indicating a key support zone. While some volatility may emerge soon, today’s market … [Read more...]
Money Wave Alert! Mar 11, 2025

3/11/2025 The Nasdaq market remained weak, showing limited strength in its recovery. Despite some bounces, the overall trend is still fragile, indicating caution is necessary. We are closely monitoring conditions as volatility persists, avoiding … [Read more...]
Money Wave Alert! Mar 10, 2025
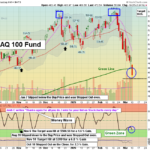
The Top Pick of the Week: MAGNIFICENT 7 FUND $MAGS was bought on the open today and will be Sold on the Close Friday 3/10/2025 The Markets had more FEAR FLUSHING today, as Panic Selling came in near the Close. Some are Selling on FEAR, … [Read more...]
- « Previous Page
- 1
- …
- 54
- 55
- 56
- 57
- 58
- …
- 491
- Next Page »