
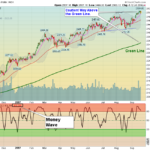
Markets are down slightly today on mild selling, as the S&P 500 tries to hold above the Pink Line (10-day avg.) to Avoid a Short Term Sell Signal. Most of the Indices are back up in the Red Zones (probably too late to Buy for the … [Read more...]
Money Wave Alert! Sep 21, 2017
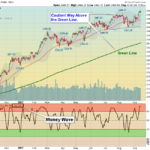
Money Wave Alert! Sep 20, 2017
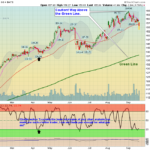
Markets are mixed today, after dropping briefly after the FED talk at 1:00pm EDT. The FED threw out a "Trial Balloon" that they will soon begin selling the $4 Trillion of Debt they bought to prop up the Markets after the 2008 Dump. The … [Read more...]
Money Wave Alert! Sep 19, 2017
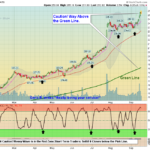
Markets are up slightly today, before the results of the FED meeting tomorrow. Don't forget that soon the FED should begin selling the $4 Trillion of Debt they bought to prop up the Markets after the 2008 Dump. The Big DOW stocks and the … [Read more...]
Money Wave Alert! Sep 18, 2017
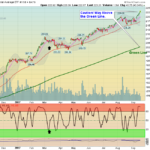
Markets "Gapped Up" today on panic buying, with the Big DOW stocks and the S&P 500 Index making New Highs again. Should be reaching a Short Term Climax soon. NASDAQ 100 Index is down today. The Semiconductors are the Strongest … [Read more...]
Money Wave Alert! Sep 15, 2017
Markets are up today, with the Big DOW stocks and the S&P 500 Index making New Highs. The Semiconductors are the Strongest Sector. Most of the Indices are back up in the Red Zones (probably too late to Buy for the Short Term), and up … [Read more...]
- « Previous Page
- 1
- …
- 435
- 436
- 437
- 438
- 439
- …
- 491
- Next Page »