
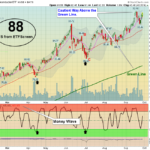
Markets are mixed today, as the Strongest Indices are back up near the Highs. Many Watch List Money Wave Buy today, but the Volume is weak on all of them. We would prefer that all the Indices also correct down some. Be patient and … [Read more...]
Money Wave Alert! Sep 28, 2017
Money Wave Alert! Sep 27, 2017

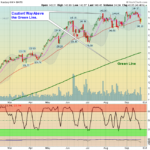
Markets are up today, as the Techs are bouncing from Over-Sold conditions. The DOW Index could be going up on Wave 5 since it bounced off the Red Line (50-day avg.) in late August. The Watch List is growing, as some Leaders are back … [Read more...]
Money Wave Alert! Sep 26, 2017
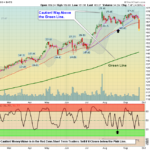
A very slow day today, as the Markets are up slightly. Some of the Strong Investments are becoming Over-Sold, and in the Green Zones. The Watch List is growing, as some Leaders are back down near their Red Lines (50-day avgs.) for possible … [Read more...]
Money Wave Alert! Sep 25, 2017
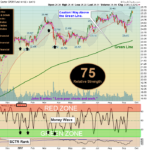
Markets are down today as the S&P 500 slipped below the Pink Line (10-day avg.) to create a Short Term Sell Signal. Most of the Indices were back up in the Red Zones (probably too late to Buy for the Short Term). WAIT for some … [Read more...]
Money Wave Alert! Sep 22, 2017
Markets are mixed today on a small range day, as the S&P 500 tries to hold above the Pink Line (10-day avg.) to Avoid a Short Term Sell Signal. Most of the Indices are back up in the Red Zones (probably too late to Buy for the Short … [Read more...]
- « Previous Page
- 1
- …
- 434
- 435
- 436
- 437
- 438
- …
- 491
- Next Page »