
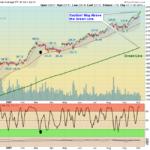
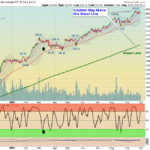
Markets are higher again today, and now it is looking like a "Melt Up" is forming. This could be HISTORIC, as Investors Panic Buy after 8 1/2 year tired Bull (Dow is 2200 points Above the Green Line). Must be betting on a new Tax Plan. … [Read more...]
Money Wave Alert! Oct 5, 2017
Money Wave Alert! Oct 4, 2017
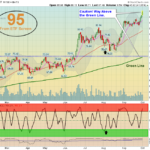
More of the same... Markets are up slightly again today, as there are few Sellers. Most of the Leaders are in the Red Zones (probably too late to Buy for the Short Term), so Short Term Traders should be raising Cash. The … [Read more...]
Money Wave Alert! Oct 3, 2017
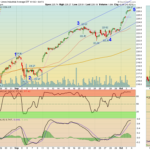
Markets are up again today, as there are few Sellers. Notice how none of the 9 recent Money Wave Buy Leaders have made New Highs this time up! The Markets seem to be running on upward momentum. The Semiconductors and … [Read more...]
Money Wave Alert! Oct 2, 2017
Markets are up again today, on a Buying stampede. The Markets seem to be running on upward momentum. The DOW Index is catching up, and made New Highs also. The Semiconductors and BioTechs are the Strongest Sectors to buy, but they are … [Read more...]
Money Wave Alert! Sep 29, 2017
Markets are up slightly today, as the Mutual Funds are doing some End of Quarter Buying. October is coming. Be patient and WAIT for some negative news to return the Leaders back down to their Green Zone for Money Wave Buys.. The … [Read more...]
- « Previous Page
- 1
- …
- 433
- 434
- 435
- 436
- 437
- …
- 491
- Next Page »