
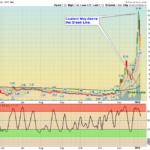
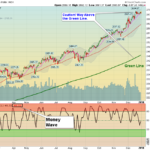
Markets were up every day this week making New Highs. No Sellers, just a Buying Stampede as the news is all Good! The S&P 500 has Support at the Pink Line of 2696 (10-day avg.). Most Leading Funds are up near the Red Zones. … [Read more...]
Money Wave Alert! Jan 5, 2018
Money Wave Alert! Jan 4, 2018
Markets are up again today making New Highs. No Sellers, as the news is all Good! The S&P 500 has Support at the Pink Line of 2690 (10-day avg.). Most Leading Funds are up near the Red Zones. Please wait for the Money Wave … [Read more...]
Money Wave Alert! Jan 3, 2018
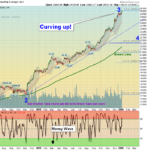
Markets are making New Highs again today as the Buying Stampede continues... Not many reasons to Sell other than Over-Bought, so most are holding for more. The S&P 500 bounced back above the Pink Line of 2683 (10-day avg.) to avoid a … [Read more...]
Money Wave Alert! Jan 2, 2018
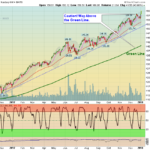
Markets are higher today but the Volume is Low. The S&P 500 is back above the Pink Line of 2683 (10-day avg.) to avoid a Short Term Sell Signal. Most Leading Funds are up near the Red Zones. Please wait for the Money Wave … [Read more...]
Money Wave Alert! Dec 29, 2017
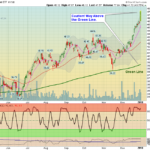
S&P 500 is Holding just Above the Pink Line. Markets are down slightly today on more slow holiday trading. The S&P 500 is holding just above the Pink Line of 2682 (10-day avg.) to avoid a Short Term Sell Signal. The Mutual … [Read more...]
- « Previous Page
- 1
- …
- 420
- 421
- 422
- 423
- 424
- …
- 491
- Next Page »