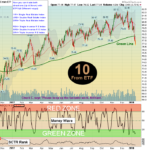
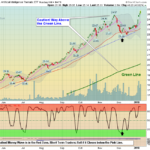
Above the Green Line -01
  • Market Insights
        • Commentary
          • Daily
          • Weekly
        • BUY / SELL SIGNALS
          • Trade Posts
          • Recent Trade Alerts
          • Recent Day Trades
        • BLOGROLL
          • Dividend Growth Blog
          • ETF Sector Blog
          • Dow Dogs
          • TPOW Blog
  • Strategies
        • SWING TRADING
          • Current Positions
          • Watchlists
          • Closed Positions
          • Candidates - TOP 100
          • Specialty Stocks
        • WEEKLY STOCK PICK
          • TPOW Charts
          • TPOW Performance
          • TPOW Strategy Guide
          • TPOW Performance Dashboard
        • DAY TRADING
          • Watch List
        • ATGL DASHBOARD
        • ETF STRATEGIES
          • ETF Sector Rotation
          • ETF Sector Portfolio
        • DIVIDEND GROWTH
          • Dividend Growth Portfolio
          • Dividend Calendar
        • DOGS OF THE DOW
          • Dogs of the Dow Portfolio
          • DOW 5 Portfolio
  • Markets
        • US MARKET
          • Commodities
          • Energy
          • Precious Metals
          • Volatility
        • GLOBAL MARKETS
          • Market Indices
          • Economic Calendar
          • FOREX Heat Map
          • FOREX Cross Rates
          • Crypto Currency Market
  • Investing
    • Discord Community
    • Dashboard
  • Resources
        • ARTICLES
          • Dividend Growth Model Articles
          • ETF Articles
          • Investment Strategies Articles
          • Market and Economic Insights
          • Stock Trade Articles
          • Stock Reviews
        • TOOLS
          • Stock Scanners
          • Charting Software
          • Brokerage Firms
        • STOCK CHARTS
          • Key Components
          • Reading Charts
          • Drawing Stock Charts
          • Identifying Trends
        • RETIREMENT PLANNING
  • About
    • Contact Us
    • How to Win
    • #1 At Stockcharts
    • Disclaimer
    • FAQ
  • Log In
  • Subscribe

Buy / Sell Signals

March 31, 2017

Money Wave Alert! Mar 31, 2017

Bank Chart

  The Markets  are very slow today as  most of the Leaders are already back up in the Red Zones. The major Indices are going up to re-test the recent Highs. The Financials are struggling at the Red Line (50-day avg), and are weaker than … [Read more...]

March 30, 2017

Money Wave Alert! Mar 30, 2017

WTIC Chart

  The Markets  are up today as  the Indices are going up to re-test the recent Highs. S0 far the Money Wave Pops have been very poor, indicating a tired Market. Most of the Leaders are already back up in the Red Zones. Short Term traders … [Read more...]

March 29, 2017

Money Wave Alert ! Mar 29, 2017

NAZ Chart

The Leading NAZ 100 is almost back up to Highs!  The Markets  are mixed today as  the Indices are resting from yesterday's bounce off of the Red Lines (50-day avg.). Now they should attempt to re-test the recent Highs. Try to EXIT … [Read more...]

March 28, 2017

Money Wave Alert! Mar 28, 2017

SPX Chart

  The Markets  are popping today as  the Indices are bouncing off of the Red Lines (50-day avg.). Now they should re-test the recent Highs. Try to EXIT positions that are not near the recent highs, and ones that are Below the Red … [Read more...]

March 27, 2017

Money Wave Alert! Mar 27, 2017

DOW Chart

  The Markets  are lower today as the Financials & Steel Groups are lower from profit-taking. Markets are now OverSold on the Short Term, and the Indices are down near the Red Lines (50-day avg.). Normally they will try to bounce soon, … [Read more...]

  • « Previous Page
  • 1
  • …
  • 419
  • 420
  • 421
  • 422
  • 423
  • …
  • 451
  • Next Page »

Subscribe to Our Newsletter

AGL Logo

Get our eBook Now!

Candlestick - A Swing Traders Friend

We don’t spam! Read our privacy policy for more info.

You’ve been successfully subscribed to our newsletter!

Voted #1 at Stock Charts

SH Chart
Inverse S&P 500 Fund (SH) will have a Money Wave Buy today.

Help Us Help Animals

Help Us Help Animals

Recent Comments

  • Market Breadth Indicators: A Trader’s Guide to Early Trend Detection on Backtesting: Definition and How a Trading Strategy Backtest Works
  • Island Reversal Pattern: Definition and Formation Explained on Double Top Pattern: How to Identify and Trade This Reversal Signal
  • Channel Pattern Guide: What It Is and Why It Matters on A Guide to Forecasting Using Moving Averages
  • What Is a Broadening Bottom Chart Pattern? Full Guide on Bull vs. Bear Market: An Investor’s Guide to Market Phases
  • ATGL Weekly Money Flow - 2025-05-11 on ATGL Top Pick of the Week! Apr 6, 2025

Become a Green Liner!

Help me make more Money in the Stock Market.

ON ATGL

  • DashBoard
  • Weekly Commentary
  • Daily Buy / Sell Signals
  • Day Trade Setup
  • Trading Rooms

Design & Develop By Pixelvect

STRATEGIES

  • Swing Trading
  • ATGL Pick of the Week
  • Dividend Growth
  • ETF Sector Rotation
  • Dogs of the Dow

HELP

  • ATGL Trading Rules
  • FAQ
  • Account Maintenance
  • Contact US
  • Join

FOLLOW US

Instagram Linkedin Twitter Facebook

© COPYRIGHT 2024 · ABOVETHEGREENLINE.COM · ALL RIGHTS RESERVED · PRIVACY · TERMS · CONTACT · WATCHLIST · CURRENT