
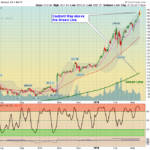
Markets are down slightly today as the NASDAQ 100 and Semiconductors are having some profit taking. Most of the Leaders are back up in the Red Zones (probably too late to Buy for the Short Term. Please be patient and WAIT for the … [Read more...]
Money Wave Alert! Mar 13, 2018
Money Wave Alert! Mar 12, 2018
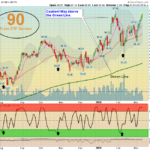
Markets are mixed today after Friday's rally. The weaker DOW JONES Index has been down most of the day. The Strongest Indices like the NASDAQ 100 and Semiconductors were able to continue higher above the Jan. & Feb Resistance. The … [Read more...]
Money Wave Alert! Mar 9, 2018
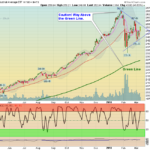
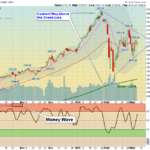
Markets "Gapped Up" today on Good News, as the Indices work their way up towards the January Highs. The Strongest Indices like the NASDAQ 100 and Semiconductors were able to push above the Jan. & Feb Resistance. Most of the Leaders … [Read more...]
Money Wave Alert! Mar 8, 2018
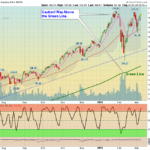
Markets were up today on lower Volume, as most of the Leaders are back up in the Red Zones (probably too late to Buy for the Short Term. We will see if the Strongest Indices like the NASDAQ 100 above can push above the Jan. & Feb … [Read more...]
Money Wave Alert! Mar 7, 2018
Markets were mostly mixed again today, after "Gapping Down" on the opening. The Strongest Leaders are not coming down enough to make it into the Green Zones for Money Wave Buys... This shows that most are not Selling. Investments that … [Read more...]
- « Previous Page
- 1
- …
- 411
- 412
- 413
- 414
- 415
- …
- 491
- Next Page »