
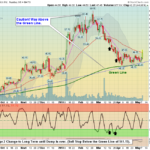
Markets were down slightly today, as the S&P 500 & DOW Indices are still struggling to get back Above the Red Lines (50-day avgs.), which should bring in more Buying. The NASDAQ 100 is Above the Red Line (50-day avg.) but is up … [Read more...]
Money Wave Alert! May 8, 2018
Money Wave Alert! May 7, 2018
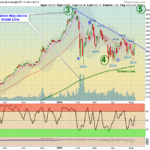
Markets were up again today, as the S&P 500 & DOW Indices are trying to get back Above the Red Lines (50-day avgs.) to bring in more Buying. The NASDAQ 100 is Above the Red Line (50-day avg.) but is up near the mid April … [Read more...]
Money Wave Alert! May 4, 2018
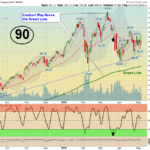
Markets "Gapped Up" today, as the NASDAQ 100 sliced Above the Red Line (50-day avg.) to bring in more Buying. The Small Caps and NASDAQ 100 Indices are holding up the best. The S&P 500 & DOW Indices still must get back Above … [Read more...]
Money Wave Alert! May 3, 2018
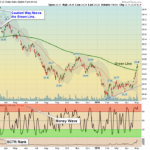
Markets dropped down in the morning, and then recovered. Some of the Indices were down near the April Support. The Small Caps and NASDAQ 100 Indices are holding up the best. The Markets must now get back Above the Red Lines (50-day … [Read more...]
Money Wave Alert! May 2, 2018
Markets were mixed again today, on lower Volume. Tech Stocks were up, with Apple Inc. bouncing up 5% on Earnings. The Markets must now get back Above the Red Lines (50-day avgs.) to bring in more Buying. Crude Oil was up today at … [Read more...]
- « Previous Page
- 1
- …
- 403
- 404
- 405
- 406
- 407
- …
- 491
- Next Page »