
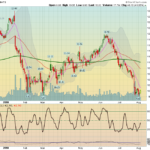
Markets were up slightly today as the rally continued from Thursday's low. So far the Money Wave Pops have been weak, probably because the Leaders did not correct much. Most Leaders are close to the previous Highs. If you are a nimble … [Read more...]
Money Wave Alert! Aug 3, 2018
Money Wave Alert! August 2, 2018
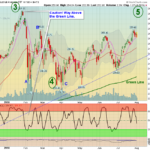
Markets were up today as most of the Leaders have popped out of their Green Zones for Money Wave Buys. Please be patient and WAIT for the Leaders to bounce out of the Green Zones, for more Money Wave Buy Signals. Crude Oil was up … [Read more...]
Money Wave Alert! Aug 1, 2018
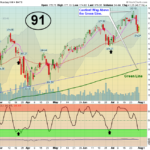
Markets were mixed and sluggish today. The Leaders are back down to their Green Zones, for Money Wave Buys soon. APPLE, INC. was up 5% today on good Earnings, and finally has Relative Strength above 90 again. Currently AAPL is … [Read more...]
Money Wave Alert! Jul 31, 2018
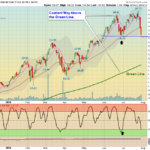
Markets were up today on lower Volume. The Leaders are coming back down to their Green Zones, for Money Wave Buys soon. Many are waiting for APPLE, INC. Earnings to come out after the Close tonight. Please be patient and WAIT for the … [Read more...]
Money Wave Alert! Jul 30, 2018
Markets were down again today as the Leaders are coming back down to their Green Zones, for Money Wave Buys soon. Please be patient and WAIT for the Leaders to return back down to their Green Zones, for more Money Wave Buy … [Read more...]
- « Previous Page
- 1
- …
- 392
- 393
- 394
- 395
- 396
- …
- 492
- Next Page »