
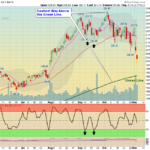
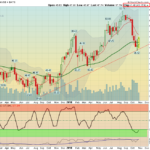
Markets were mostly up today, but have not exceeded Friday's High. The Big FAANG Stocks are still under pressure. The S&P is finally going to Close above Green Line of 2726. Election Results are Tuesday night. Many Leaders are back … [Read more...]
Money Wave Alert! Nov 5, 2018
Money Wave Alert! Nov 2, 2018
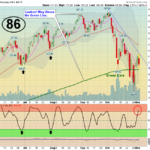
Markets were down today as AAPL dropped on Earnings concerns, and many Leaders are back up in the Red Zones (probably too late to Buy for the Short Term). The S&P is still struggling to Close above Green Line of 2726. Be careful … [Read more...]
Money Wave Alert! Nov 1, 2018
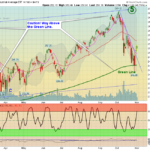
Markets were higher again today as buying continued on Lower Volume. The S&P needs to Close above Green Line of 2726. Short Term the Markets are becoming over-bought as the DOW Index has rallied 1200 point from the Low. Be … [Read more...]
Money Wave Alert! Oct 31, 2018
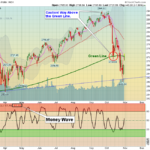
Markets "Gapped Up" today on the first good Buying in a while. Looks like a lot of Short Covering to take profits from betting on a drop. The Selling appears to be almost complete, but maybe once more down. The S&P needs to Close … [Read more...]
Money Wave Alert! Oct 30, 2018
Markets were up today but the Indices still have more work to draw in Buyers. The Selling appears to be almost complete. The S&P needs to Close above Pink Line (10-day avg.) of 2718. The Markets are extremely over-sold, indicating … [Read more...]
- « Previous Page
- 1
- …
- 379
- 380
- 381
- 382
- 383
- …
- 492
- Next Page »