
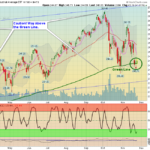
Markets were up today as mild buying came into over-sold Investments. Many are waiting to see if the Indices are going to Hold and Bounce at the Support of the October Lows. If the S&P 500 can make a Higher Low or Double Bottom … [Read more...]
Money Wave Alert! Nov 26, 2018
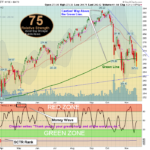
Money Wave Alert! Nov 23, 2018
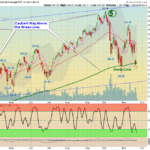
Markets were down today as AAPL is still weak and dragging down the Tech sector. Volume was Low Holiday trading. We are waiting to see if the Indices are going to Hold and Bounce at the Support of the October Lows. If the S&P … [Read more...]
Money Wave Alert! Nov 21, 2018
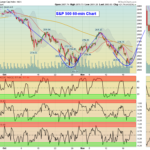
Markets were up today as the Tech and Momentum stocks finally bounced from being over-sold. We are waiting to see if the Indices are going to Hold and Bounce at the Support of the October Lows. If the S&P 500 can make a Higher … [Read more...]
Money Wave Alert! Nov 20, 2018
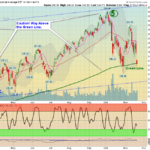
Markets were down again today, as the Tech and Momentum stock were lower, but some reversed back up. Volume is Low. The Indices are going back down to re-test the October Lows. Until we know if Support holds, Buying will not be … [Read more...]
Money Wave Alert! Nov 19, 2018
Markets were down today, as the Tech and Momentum stock got whacked. Volume is Low. Many do not feel that the Indices put in a Higher Low than the October Lows. Until that is known, Buying will not be solid. If the S&P 500 can make … [Read more...]
- « Previous Page
- 1
- …
- 376
- 377
- 378
- 379
- 380
- …
- 492
- Next Page »