
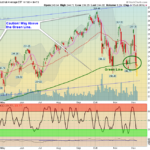
Markets dropped down again today as the S&P 500 took out the 2603 Support, but then had a mild rally. Selling should be getting "Washed Out". The HERD that bought at the Highs in September is selling at a loss on Bad News. … [Read more...]
Money Wave Alert! Dec 10, 2018
Money Wave Alert! Dec 7, 2018
Money Wave Alert! Dec 6, 2018
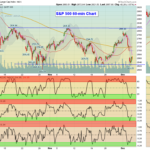
So much for the "W" pattern back up! Markets dumped down again today on Economic Slow Down Fears. The Markets are warning the FED not to Raise Rates this month, and telling Trump to get a China Trade Deal soon. The S&P 500 needs to hold … [Read more...]
Money Wave Alert! Dec 5, 2018

PLEASE NOTE: DUE TO THE STOCK MARKET BEING CLOSED IN MEMORY OF GEORGE H. W. BUSH ON WEDNESDAY, THERE WILL BE NO GREEN LINE EMAIL ON WEDNESDAY. PLEASE LOOK FOR THE MONEY WAVE ALERT! TO ARRIVE ON THURSDAY, AS SCHEDULED. THANK … [Read more...]
Money Wave Alert! Dec 4, 2018
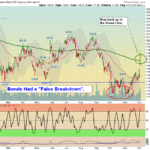
Markets dumped down today on profit taking as Smart Money sold on the Good News. The rally was over-bought on the Short Term as the Leaders were back up in the Red Zones (probably too late to Buy for the Short Term). The Leaders should … [Read more...]
- « Previous Page
- 1
- …
- 374
- 375
- 376
- 377
- 378
- …
- 492
- Next Page »