
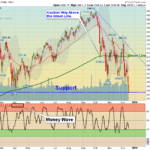
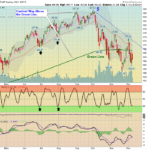
Markets were down again today as the Indices continue down to the April Lows. The Volume is lower, and the FEAR Index is not making new Highs, maybe indicating a Market bottom soon. The Markets are warning the FED not to Raise Rates on … [Read more...]
Money Wave Alert! Dec 17, 2018
Money Wave Alert! Dec 14, 2018
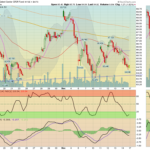
Markets were down again today as the Indices are re-testing last week's LOW (2583 on the S&P 500). The Markets are warning the FED about raising Rates next Wednesday, and for a Trade Deal with China. Markets are very over-sold, … [Read more...]
Money Wave Alert! Dec 13, 2018
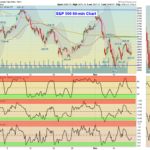
Markets were down slightly today but the FEAR Selling seems to be fading. Investors need a reason to Buy, so the Volume has been low. The S&P 500 needs to Close above 2709 to pull in more Buyers. Selling should be getting "Washed … [Read more...]
Money Wave Alert! Dec 12, 2018
Markets "Gapped Up" again this morning, pulled back some but it looks like it will be an up day today. The S&P 500 needs to Close above 2709 to pull in more Buyers. Selling should be getting "Washed Out". The HERD that bought at … [Read more...]
Money Wave Alert! Dec 11, 2018
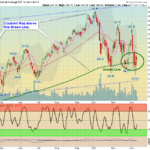
Markets "Gapped Up" this morning, but needed to correct some of the 800 point DOW Rally from yesterday's Low . Maybe a Higher Low today would be "Bullish". Selling should be getting "Washed Out". The HERD that bought at the Highs in … [Read more...]
- « Previous Page
- 1
- …
- 373
- 374
- 375
- 376
- 377
- …
- 492
- Next Page »