
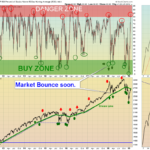
Markets were mixed again today after having a rally in the morning on Good News. The Tech stocks were lower, and there was weakness from AMZN Earnings. The S&P 500 currently very Over-bought on the Short Term after a 15% bounce up … [Read more...]
Money Wave Alert! Feb 1, 2019
Money Wave Alert! Jan 31, 2019
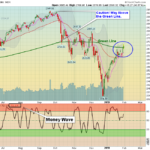
Markets were mixed today after yesterday's big rally. The S&P 500 should close Above the Green Line today, but it is currently very Over-bought on the Short Term. Please be patient and WAIT for Money Wave Buy Signals. Most of the … [Read more...]
Money Wave Alert! Jan 30, 2019
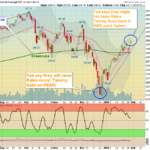
Last month the FED said they would be Raising Interest Rates more this year, and the DOW Index dumped to 21700 on FEAR SELLING. Now the FED says they might not Raise Rates any more soon, so Tammy piles back into the DOW Index at … [Read more...]
Money Wave Alert! Jan 29, 2019
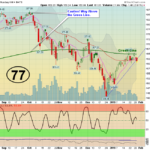
Markets were mixed today as Investors wait for AAPL & AMD Earnings after the Close tonite. The S&P 500 has Support at 2613, and needs to hold above that level. Volume was low in a tight range day. Crude Oil was up $1.15 … [Read more...]
Money Wave Alert! Jan 28, 2019
Markets were down today as the Indices could not exceed last Tuesday's Highs. Not much selling though, and the Markets should Close well above today's Lows. The S&P 500 has Support at 2613, and needs to hold above that level. Volume … [Read more...]
- « Previous Page
- 1
- …
- 366
- 367
- 368
- 369
- 370
- …
- 491
- Next Page »