
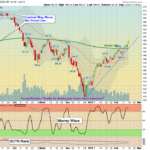
MARKETS WILL BE CLOSED ON MONDAY FOR A FEDERAL HOLIDAY. Markets popped up today as the FEAR is completely gone with positive Consumer Confidence numbers. Sellers are now holding off. Markets are quickly over-bought again, as many … [Read more...]
Money Wave Alert! Feb 15, 2019
Money Wave Alert! Feb 14, 2019
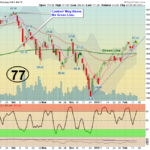
HAPPY VALENTINE's DAY! Markets were mixed today on lower Volume . The NASDAQ 100 Index of mainly Tech Stocks needs to hold above the Pink Line to avoid a Short Term Sell Signal. Markets are quickly over-bought again, as many … [Read more...]
Money Wave Alert! Feb 13, 2019
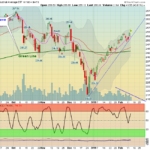
Markets were higher again today on lower Volume . The S&P 500 successfully bounced up off the Pink Line and was able to close higher than last week's high of 2739. Markets are quickly over-bought again, as many Leaders are back … [Read more...]
Money Wave Alert! Feb 12, 2019
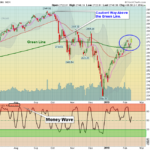
Markets were higher today on solid buying . The S&P 500 successfully bounced up off the Pink Line and needs to close higher than last week's high of 2739. Several on the Money Wave Buy list "Gapped Up" today more than 3%, so they … [Read more...]
Money Wave Alert! Feb 11, 2019

Markets were mixed today on low Volume as only the Strongest Leaders seem to have much Buying. The S&P 500 is trying to hold above the Pink Line of 2705. The Money Wave Buy list is growing as the Leaders are now correcting … [Read more...]
- « Previous Page
- 1
- …
- 364
- 365
- 366
- 367
- 368
- …
- 491
- Next Page »