
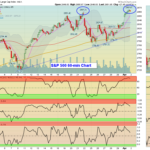
Markets "Gapped Up" today as the Markets try to get above the March Highs. So far the DOW Index and S&P 500 Index are higher than March. Utilities and Bonds are starting to lose momentum after a big rally from lower Interest … [Read more...]
Money Wave Alert! Apr 1, 2019
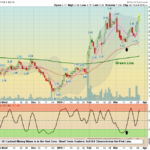
Money Wave Alert! Mar 29, 2019
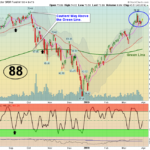
Markets were up today on End of the Quarter buying. Utilities are starting to lose momentum after a big rally from lower Interest Rates. Many of the Leaders are slowly returning back down to their Green Zones for Money Wave Buy Signals … [Read more...]
Money Wave Alert! Mar 28, 2019
Markets were up slightly today but the Bonds continued higher on Economic weakness fears. Utilities are starting to lose momentum after a big rally from lower Interest Rates. Bonds are back up in the Red Zone (probably too late to Buy … [Read more...]
Money Wave Alert! Mar 27, 2019
Markets were down slightly today as the Bonds continued higher on Economic weakness fears. Bonds are back up in the Red Zone (probably too late to Buy for the Short Term) and the S&P 500 Index is almost back down to the Green … [Read more...]
Money Wave Alert! Mar 26, 2019
Markets "Gapped Up" this morning and then faded near the Close on low Volume. Many of the Leaders are having very low Volume as they slowly return back down to their Green Zones. Please be patient and WAIT for the Leaders to return back … [Read more...]
- « Previous Page
- 1
- …
- 358
- 359
- 360
- 361
- 362
- …
- 491
- Next Page »