
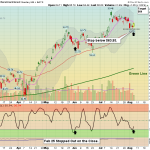
Aug 6, 2025 Markets were higher today as the S&P 500 & NASDAQ 100 need to retest the recent highs again. Buying was slow and the broad Markets are sluggish. Gold Miners (GDX) are back on the highs, and a Swing Buy Signal today on Bit-Coin … [Read more...]
Money Wave Alert! Aug 6, 2025
Money Wave Alert! Aug 5, 2025
Top Pick of the Week: Uranium Fund $URA reached our 4 % conservative Target today, so we will capture that. Some investors might hold for the Max 8 % Gain in the week. Aug 5, 2025 Today’s Nasdaq session opened with a slight upward push, but SPY … [Read more...]
Money Wave Alert! Aug 4, 2025
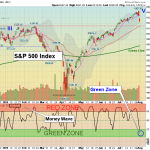
The Top Pick of the Week: Global X Uranium ETF. $URA was bought on the open today and will be sold on Friday Close. Aug 4, 2025 Today, the Nasdaq saw a strong bullish recovery following Friday's News sell-off, with SPY and overall markets … [Read more...]
Money Wave Alert! Aug 1, 2025
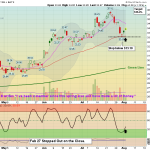
The Top Pick of the Week: Zscaler Inc. $ZS will be Sold on the Close with a small Loss. Aug 1, 2025 Markets Gapped Down today as the S&P 500 and NASDAQ 100 Funds finally broke below the Pink Lines (10-day avgs.). Now the Indices could to be … [Read more...]
Money Wave Alert! Jul 31, 2025
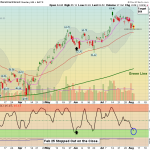
July 31, 2025 Markets Gapped Up on higher Earnings for MSFT & META. The S&P 500 and NASDAQ 100 Funds made higher highs again with the high weighting of those 2 stocks. The weaker Indices that dropped below the Pink Lines, are struggling (DIA … [Read more...]
- « Previous Page
- 1
- …
- 34
- 35
- 36
- 37
- 38
- …
- 491
- Next Page »