
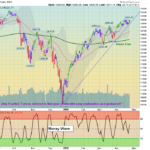
Markets were mixed today after Tuesday's rally. The S&P 500 Index is now back up to the Sept. Highs of 2018, so there will normally be Resistance and Sellers up here. The S&P INDEX needs to hold up above the Pink Line of 2907 to … [Read more...]
Money Wave Alert! Apr 24, 2019
Money Wave Alert! Apr 23, 2019
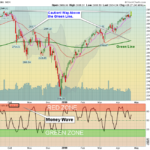
Markets "Gapped Up" on Good Earnings and Good News. The S&P 500 Index is now back up to the Sept. Highs of 2018, as it bounced up above the Pink Line of 2900 to avoid a Short Term Sell Signal. Please WAIT for the Leaders to return … [Read more...]
Money Wave Alert! Apr 22, 2019
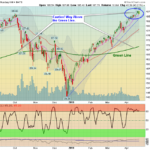
Markets were mixed today, on a small range day. The S&P 500 Index is drifting sideways, but has been holding above the Pink Line of 2898 to avoid a Short Term Sell Signal. Please WAIT for the Leaders to return back down to their … [Read more...]
Money Wave Alert! Apr 18, 2019
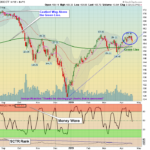
MARKETS WILL BE CLOSED ON FRIDAY APRIL 19th to CELEBRATE GOOD FRIDAY. Markets were up today, on lower pre-holiday Buying. The S&P 500 Index dipped below the Pink Line of 2896 this morning, but bounced up to avoid a Short Term Sell … [Read more...]
Money Wave Alert! Apr 17, 2019
Markets were down slightly today, as the Health Care Stocks were under pressure. The S&P 500 Index needs to stay above the Pink Line of 2894 to avoid a Short Term Sell Signal. Please WAIT for the Leaders to return back down to … [Read more...]
- « Previous Page
- 1
- …
- 355
- 356
- 357
- 358
- 359
- …
- 491
- Next Page »