
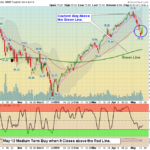
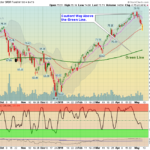
Markets were up again today after dipping back down this morning and holding above Monday's low. The Leaders are down to their Green Zones for Money Wave Buys soon. The S&P 500 Index needs to Close back above the Red Line (50-day … [Read more...]
Money Wave Alert! May 15, 2019
Money Wave Alert! May 14, 2019
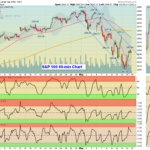
Markets rallied up today after being extremely Over-Sold. The Markets might go back down again to re-test Monday's low. The Leaders are down to their Green Zones for Money Wave Buys soon. The S&P 500 Index needs to Close back … [Read more...]
Money Wave Alert! May 13, 2019
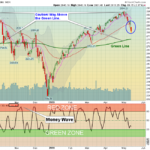
Markets dumped down today on negative Trade News. The Markets are going down to force Trump to get a Trade Deal. The Leaders are down to their Green Zones for Money Wave Buys soon. The S&P 500 Index slipped below the Red Line … [Read more...]
Money Wave Alert! May 10, 2019
Markets were up slightly today after dropping down in the morning. The Leaders are coming down to their Green Zones for Money Wave Buys soon. Markets might have discounted the Trade News. The S&P 500 Index is down near the Red Line … [Read more...]
Money Wave Alert! May 9, 2019
Markets were down today as the Leaders are coming down to their Green Zones for Money Wave Buys soon. Many are waiting on Trade News tomorrow. The S&P 500 Index is down near the Red Line (50-day avg.) of 2860 and should bounce up near … [Read more...]
- « Previous Page
- 1
- …
- 352
- 353
- 354
- 355
- 356
- …
- 491
- Next Page »