
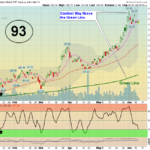
Markets were down slightly today on profit taking and lower Volume... Not much movement or Selling, as Buyers are waiting for better prices. The S&P 5oo Index should have Support on the Red Line (50-day avg.) of 2845. Please be … [Read more...]
Money Wave Alert! Jun 12, 2019
Money Wave Alert! Jun 11, 2019
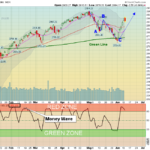
Markets were mixed today on profit taking and lower Volume... Not much Selling, but Buyers are waiting for better prices. The S&P 5oo Index should have Support on the Red Line (50-day avg.) of 2843. Please be patient and WAIT for … [Read more...]
Money Wave Alert! Jun 10, 2019
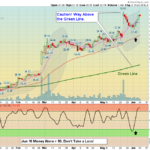
Markets were higher today on Good News with Mexico, and the FEAR seems to have gone away. The S&P 5oo Index should have Support on the Red Line (50-day avg.) of 2842. Recent Good News might cause some profit taking soon by Smart … [Read more...]
Money Wave Alert! Jun 7, 2019
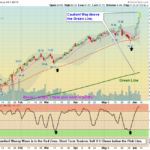
Markets were up again today as the FEAR seems to have gone away after a 4 1/2 % pop on the S&P 5oo Index this week. Support on the S&P 500 is now the Red Line (50-day avg.) of 2840. Many Leading Investments are quickly … [Read more...]
Money Wave Alert! Jun 6, 2019
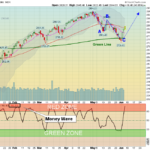
Markets were up again today as the S&P 5oo Index was now able to get slightly above the Red Line (50-day avg.) of 2839. Many Leading Investments are quickly becoming over-bought and are in the Red Zones (probably too late to Buy for … [Read more...]
- « Previous Page
- 1
- …
- 348
- 349
- 350
- 351
- 352
- …
- 491
- Next Page »