
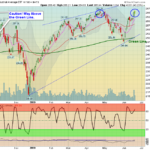
Markets were up again today as the FED basically said that they will do what is necessary to keep the Economy expanding. The FED did not Lower the Fed Funds rate today, but are expected to at the July meeting. The S&P 5oo Index … [Read more...]
Money Wave Alert! Jun 19, 2019
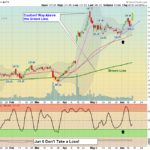
Money Wave Alert! Jun 18, 2019
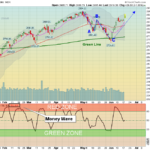
Markets were up again today on Good News Buying ... Favorable info about China trade and it looks like many are waiting on the Fed meeting results tomorrow. The FED is expected to Lower the Fed Funds rate, but they might wait until the … [Read more...]
Money Wave Alert! Jun 17, 2019
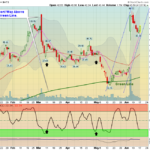
We are having problems retrieving Quotes for the Watch List and Portfolio... Please be patient while this is being fixed. Markets were up slightly today in a tight range on low Volume ... Looks like many are waiting on the Fed … [Read more...]
Money Wave Alert! Jun 14, 2019
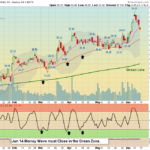
Markets were mixed today on more low Volume day ... Looks like many are waiting on the Fed meeting next week. The FED is expected to Lower the Fed Funds rate. The S&P 5oo Index should have Support on the Red Line (50-day avg.) of … [Read more...]
Money Wave Alert! Jun 13, 2019
Markets were up slightly today on a very slow and low Volume day ... Not much Selling, as the Strongest Leaders are holding up very well so far. Many are waiting on the Fed meeting next week. The S&P 5oo Index should have Support on … [Read more...]
- « Previous Page
- 1
- …
- 347
- 348
- 349
- 350
- 351
- …
- 491
- Next Page »