
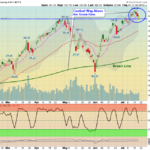
Markets were mixed today after recovering from a drop this morning on low Volume. The S&P 500 Index closed below the Pink Line (10-day avg.) yesterday around 2994 and did not DUMP, so Buyers still have more Money. Maybe a re-test of … [Read more...]
Money Wave Alert! Jul 18, 2019
Money Wave Alert! Jul 17, 2019
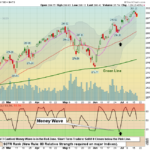
Markets were down slightly on more low Volume. The S&P 500 Index is weaker and might Close below the Pink Line (10-day avg.) around 2996 to create a Short Term Sell Signal. Short Term traders might want to raise some Cash and WAIT for … [Read more...]
Money Wave Alert! Jul 16, 2019
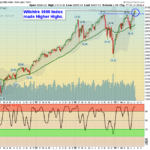
Markets were mixed again today on very low Volume. The S&P 500 Index is over bought and needs to bounce off the Pink Line (10-day avg.) around 2994 to avoid a Short Term Sell Signal. Short Term traders might want to raise some Cash … [Read more...]
Money Wave Alert! Jul 15, 2019
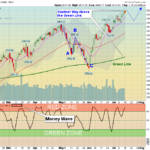
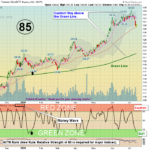
Markets were mixed today on very low Volume. The S&P 500 Index is over bought and in the Red Zone, and might pull back down to re-test the 2960 Support in a few days (see Chart above) before rallying more. Short Term traders might … [Read more...]
Money Wave Alert! Jul 12, 2019
Markets were higher today as the DOW Index surged up more. The S&P 500 Index got above the recent High of 2996, and is now at 3012 for the rally to continue. Markets are currently over-bought so Short Term traders might want to raise … [Read more...]
- « Previous Page
- 1
- …
- 343
- 344
- 345
- 346
- 347
- …
- 491
- Next Page »