
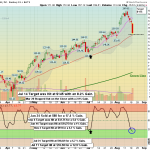
Aug 19, 2025 Markets were lower today the Techs and Momentum Stocks dropped sharply to remove some of the excess Margin (Borrowed Money). The SPY & NASDAQ 100 Funds look to Close below the Pink Lines (10-day avgs.) for short term Sell Signals. … [Read more...]
Money Wave Alert! Aug 19, 2025
Money Wave Alert! Aug 18, 2025
The Top Pick of the Week: Sibanye Stillwater $SBSW was bought on the Open today and will be Sold on the Close Friday. Aug 18, 2025 Markets were mixed today the Buyers still have some Money to commit to Stocks at these over-bought levels. The … [Read more...]
Money Wave Alert! Aug 15, 2025
The Top Pick of the Week: AeroVironment Inc. $AVAV will be Sold on the Close today. Aug 15, 2025 Today the Nasdaq opened with a bearish downside move that persisted throughout the day, reversing from its earlier strength. The SPY formed a … [Read more...]
Money Wave Alert! Aug 14, 2025
Aug 14, 2025 Markets were lower this morning as the SPY & NASDAQ 100 Funds were up in the Red Zones (probably too late to Buy for the short term). Inflation News came out this morning stronger than expected, so profit taking came in. The Best … [Read more...]
Money Wave Alert! Aug 13, 2025
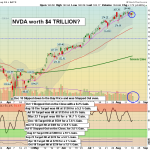
Aug 13, 2025 Markets were higher again today as the SPY & NASDAQ 100 Funds pushed higher, to Squeeze out more Short Sellers. Some of the Darlings like DASH, HOOD PLTR & NVDA were weaker after extreme valuations. The Greed is massive, as FOMO … [Read more...]
- « Previous Page
- 1
- …
- 32
- 33
- 34
- 35
- 36
- …
- 491
- Next Page »