
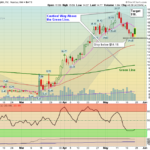
MARKETS WILL BE CLOSED ON MONDAY MAY 25, 2020 FOR MEMORIAL DAY HOLIDAY. Markets were down slightly again today on very low Holiday Volume. The S&P 500 Index is still struggling to hold just Above the Green Line of 2937. Investor's FEAR is down … [Read more...]
Money Wave Alert! May 22, 2020
Money Wave Alert! May 21, 2020
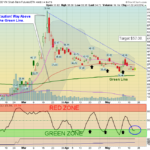
Markets were slightly lower today as the S&P 500 Index is still struggling to hold above the April High of 2955 again. The FEAR is down and the Volatility Index is back down in the Green Zone, which normally means that the Markets would … [Read more...]
Money Wave Alert! May 20, 2020
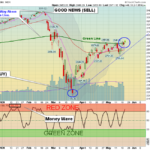
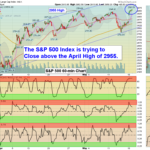
Markets were up today as the S&P 500 Index is trying to Close above the April High of 2955 again. Markets are slightly higher than yesterday's High. The Techs and Gold Miners have been able to make Higher Highs today. The Volume is … [Read more...]
Money Wave Alert! May 19, 2020
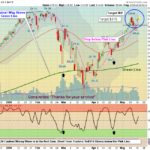
Markets were mixed today after yesterday's big rally. The S&P 500 Index is still struggling above the April High of 2955, so it has not been a decisive Break Out. Some Techs and Gold Miners have been able to make Higher Highs today. The … [Read more...]
Money Wave Alert! May 18, 2020
Markets "Gapped Up" big today on panic Buying, but the Volume was only about 1/2 of normal. The low Volume tells us that everyone is not convinced about the Economy. The BioTechs were the Leaders today on Covid 19 Cure hopes. Swing … [Read more...]
- « Previous Page
- 1
- …
- 300
- 301
- 302
- 303
- 304
- …
- 491
- Next Page »