
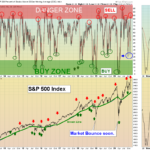
Markets were up slightly today after going down to the Pink Lines (10-day avgs.) and bouncing up to avoid a Short Term Sell Signal. Now the Indices need to make Higher Highs for this rally to continue. The Indices are struggling at the Resistance of … [Read more...]
Money Wave Alert! Nov 19, 2020
Money Wave Alert! Nov 18, 2020
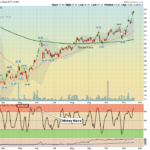
Markets were down slightly again today as the Indices are struggling at the Resistance of last Monday's Highs. The Volume is low (not many Buyers). Most quarterly Earnings are out and the Markets are over-bought for the Short Term. The DOW 30 Index … [Read more...]
Money Wave Alert! Nov 17, 2020
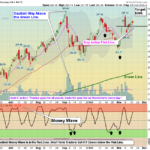
Markets were down slightly today as the Indices are struggling at last Monday's Highs. So far very few Indices or Leaders have gone higher than last week, and the Volume is low (not many Buyers). Most quarterly Earnings are out and the Markets are … [Read more...]
Money Wave Alert! Nov 16, 2020
Markets were up again today as the Indices are back up re-testing last Monday's Highs. So far very few Indices or Leaders have gone higher than last week, and the Volume is low (not many Buyers). The Markets are over-bought for the Short Term. The … [Read more...]
Money Wave Alert! Nov 13, 2020

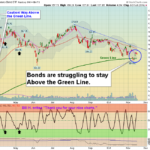
Markets were up today as the Indices need to re-test Monday's Highs. The Indices did not come down enough to reach the Green Zones for more Money Wave Buy Signals yet. The Small Cap Index or Russell 2000 is currently the Strongest major Index. New … [Read more...]
- « Previous Page
- 1
- …
- 275
- 276
- 277
- 278
- 279
- …
- 491
- Next Page »