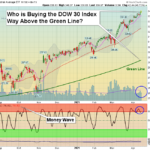
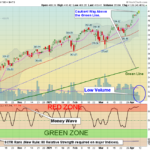
Above the Green Line -01
  • Market Insights
        • Commentary
          • Daily
          • Weekly
        • BUY / SELL SIGNALS
          • Trade Posts
          • Recent Trade Alerts
          • Recent Day Trades
        • BLOGROLL
          • Dividend Growth Blog
          • ETF Sector Blog
          • Dow Dogs
          • TPOW Blog
  • Strategies
        • SWING TRADING
          • Current Positions
          • Watchlists
          • Closed Positions
          • Candidates - TOP 100
          • Specialty Stocks
        • WEEKLY STOCK PICK
          • TPOW Charts
          • TPOW Performance
          • TPOW Strategy Guide
          • TPOW Performance Dashboard
          • Why Weekly Trading Works
        • DAY TRADING
          • Watch List
        • ATGL DASHBOARD
        • ETF STRATEGIES
          • ETF Sector Rotation
          • ETF Sector Portfolio
        • DIVIDEND GROWTH
          • Dividend Growth Portfolio
          • Dividend Calendar
        • DOGS OF THE DOW
          • Dogs of the Dow Portfolio
          • DOW 5 Portfolio
  • Markets
        • US MARKET
          • Commodities
          • Energy
          • Precious Metals
          • Volatility
        • GLOBAL MARKETS
          • Market Indices
          • Economic Calendar
          • FOREX Heat Map
          • FOREX Cross Rates
          • Crypto Currency Market
  • Investing
    • Discord Community
    • Dashboard
  • Resources
        • INVESTING GUIDES
          • Dividend Growth Guide
          • Investment Strategy Framework
          • ETF Investing Handbook
          • Stock Trading Handbook
        • ARTICLES
          • Dividend Growth Model Articles
          • ETF Articles
          • Investment Strategies Articles
          • Market and Economic Insights
          • Stock Trade Articles
          • Stock Reviews
        • TOOLS
          • Stock Scanners
          • Charting Software
          • Brokerage Firms
          • Stocks We Review
        • STOCK CHARTS
          • Key Components
          • Reading Charts
          • Drawing Stock Charts
          • Identifying Trends
  • About
    • Contact Us
    • How to Win
    • #1 At Stockcharts
    • Disclaimer
    • FAQ
  • Log In
  • Subscribe

Buy / Sell Signals

March 25, 2021

Money Wave Alert! Mar 25, 2021

SPX Chart

Markets were  higher today as Tech & Momentum Stocks firmed up on mild Buying. Many of the Leaders are about to have Money Wave Buy Signals soon. Try to Buy Investments that are still above the Red Lines (50-day avgs.) as they tend to bounce … [Read more...]

March 24, 2021

Money Wave Alert! Mar 24, 2021

GME Chart

Markets were mixed today as Tech & Momentum Stocks continued to be under selling pressure. Oil Stocks firmed up, but Volume was low everywhere. Some are now worried about Economic weakness, but the Leaders were just very over-bought. More Money … [Read more...]

March 23, 2021

Money Wave Alert! Mar 23, 2021

IWM Chart

Markets were lower today as Retail and Oil Stocks dumped. Some are now worried about Economic weakness, but the Leaders were just very over-bought.  The Market had no power left as many Investors were reluctant to Buy up at the Highs (Tammy spent … [Read more...]

March 22, 2021

Money Wave Alert! Mar 22, 2021

RIOT Chart

Markets were higher today on mild buying as the Indices attempt to rally back up to re-test the recent Highs. The Market has no power left as many Investors are reluctant to Buy up at these levels. More Money Wave Buy Signals soon, but the Pops have … [Read more...]

March 19, 2021

Money Wave Alert! Mar 19, 2021

XLE Chart

Markets were mixed today on low Spring Break Volume. The Market does not have many Sellers with the FED Printing, but it also does not seem to have much New Money to Buy up at these levels. Money Wave Buy Signal Pops have been weak recently.  The … [Read more...]

  • « Previous Page
  • 1
  • …
  • 253
  • 254
  • 255
  • 256
  • 257
  • …
  • 487
  • Next Page »

Subscribe to Our Newsletter

AGL Logo

Get our eBook Now!

Candlestick - A Swing Traders Friend

We don’t spam! Read our privacy policy for more info.

You’ve been successfully subscribed to our newsletter!

Voted #1 at Stock Charts

SH Chart
Inverse S&P 500 Fund (SH) will have a Money Wave Buy today.

Help Us Help Animals

Help Us Help Animals

Recent Comments

  • How to Use Net Present Value (NPV) for Dividend Stocks on How To Analyze Stocks With the Dividend Discount Model
  • How to Use Net Present Value (NPV) for Dividend Stocks on How To Develop an Effective Dividend Investing Strategy
  • How to Use Net Present Value (NPV) for Dividend Stocks on Why Is Time Value of Money Important for Investors
  • Free Cash Flow (FCF) Guide: Dividend Safety & Financial Strength on Dividend Payout Ratio: Definition, Formula, and Calculations
  • Dividend Payout Ratio: Definition, Formula, and Calculations on How To Analyze Stocks With the Dividend Discount Model

Become a Green Liner!

Help me make more Money in the Stock Market.

ON ATGL

  • DashBoard
  • Weekly Commentary
  • Daily Buy / Sell Signals
  • Day Trade Setup
  • Trading Rooms

Design & Develop By Pixelvect

STRATEGIES

  • Swing Trading
  • ATGL Pick of the Week
  • Dividend Growth
  • ETF Sector Rotation
  • Dogs of the Dow

HELP

  • ATGL Trading Rules
  • FAQ
  • Account Maintenance
  • Contact US
  • Join

FOLLOW US

Instagram Linkedin Twitter Facebook

© COPYRIGHT 2024 · ABOVETHEGREENLINE.COM · ALL RIGHTS RESERVED · PRIVACY · TERMS · CONTACT · WATCHLIST · CURRENT