
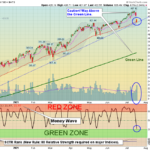
Markets were sharply lower today as the Media has convinced Investors to worry about the Virus again. Dozens of Leaders are back down in the Green Zones, so we are focusing mainly on the ones that can hold above the Red Lines (50-day averages) with … [Read more...]
Money Wave Alert! Jul 19, 2021
Money Wave Alert! Jul 16, 2021
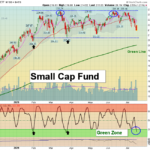
Markets were lower again today as yesterday's bounce up off the Pink Lines (10-day avgs.) was weak and more Selling came in. This created a Short Term Sell Signal. Many stocks were down today, but the Selling was not heavy Many Leaders are quickly … [Read more...]
Money Wave Alert! Jul 15, 2021
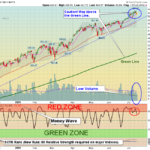
Markets were mostly lower today as the Indices went down to the Pink Lines (10-day avgs.) and bounced. Closing below the Pink Lines would normally create a Short Term Sell Signal. Many stocks were down today. More talk about when the FED will … [Read more...]
Money Wave Alert! Jul 14, 2021
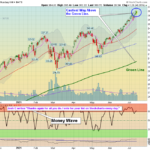
Markets were slightly higher today on low Volume Buying. The NASDAQ 100 Index was able to make New Highs on Big Tech Buying. Currently the 10 largest Stocks in the NASDAQ 100 account for 54% of the total Value of the Index (not just 10 %). This is … [Read more...]
Money Wave Alert! Jul 13, 2021
Markets were slightly lower today on light profit taking. Consumer Prices rose at a 5.4% annual rate, but the Markets were convinced that Inflation is temporary. Quarterly Earnings are starting to come out. The NASDAQ 100 Index was able to make New … [Read more...]
- « Previous Page
- 1
- …
- 240
- 241
- 242
- 243
- 244
- …
- 489
- Next Page »