
Markets were mixed today as the Indices are back up in the Red Zones (probably too late to Buy for the Short Term) and are over-bought. The strong US Dollar and Interest Rates should go up once more to re-test the Highs, and Tech Stocks probably … [Read more...]
Money Wave Alert! Aug 1, 2022
Money Wave Alert! Jul 29, 2022
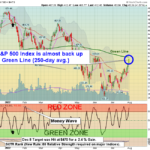
Markets were higher again today as the FEAR has disappeared, and the Indices are returning back up to the Green Lines (like they always do). Many are hoping that the Markets have bottomed, but most investments are still Below the Green Lines … [Read more...]
Money Wave Alert! Jul 28, 2022
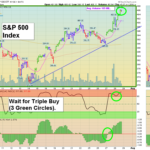
Markets were higher again today as Value Investors are buying the weaker stocks that are coming off the bottom, but are Below the Green Lines. There can be some nice "bottom fish" pops up off the lows, but many times the weak investments will have to … [Read more...]
Money Wave Alert! Jul 27, 2022
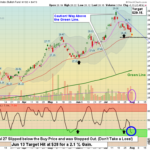
Markets were higher today as the Indices rallied on the Bad News of the FED raising short term Interest Rates 3/4 of a point. This rate hike had already been discounted and NASDAQ 100 and Tech stocks popped up sharply. Many are hoping that the … [Read more...]
Money Wave Alert! Jul 26, 2022
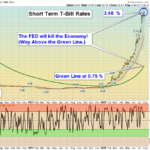
Markets were lower again today as investors are worried about the FED meeting tomorrow. The FED is supposed to raise short term Interest Rates 3/4 of a point. This has probably already been discounted and we could see a stock rally afterwards. Apple … [Read more...]
- « Previous Page
- 1
- …
- 187
- 188
- 189
- 190
- 191
- …
- 490
- Next Page »