
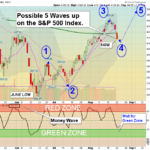
Markets were sharply lower today as the Indices are correcting some of the big rally for the last four weeks, on Wave 4 down. Most of the major Indices are back below the Green Lines after getting short term Sell Signals last week. But the Indices … [Read more...]
Money Wave Alert! Aug 22, 2022
Money Wave Alert! Aug 19, 2022
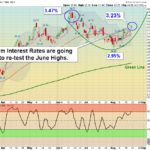
Markets were lower today as long term Interest Rates were higher. Long term Interest Rates are going back up to re-test the June Highs. Maybe you followed the Rules and bought the Inverse T-Bond Fund (TBT) recently, which has an 11% Gain. The … [Read more...]
Money Wave Alert! Aug 18, 2022
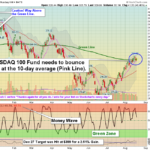
Markets were mixed to slightly higher today as the Indices are still trying to bounce up off the Pink Lines (10-day avgs.) to avoid short term Sell Signals. If the Indices can bounce, then they need to make higher highs. The FOMO Buying (Fear Of … [Read more...]
Money Wave Alert! Aug 17, 2022
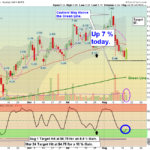
Markets were down most of the day and the Indices had a very mild pull back. The Indices are trying to bounce up off the Pink Lines (10-day avgs.) to avoid short term Sell Signals. Investors have FOMO again (Fear Of Missing Out). Many of the Indices … [Read more...]
Money Wave Alert! Aug 16, 2022
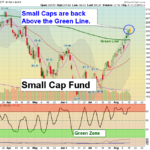
Markets were mixed today after the S&P 500 Index continued to make a Higher High on very low summer Volume. Investors are hoping that Inflation has peaked, and now they have FOMO again (Fear Of Missing Out). Many of the Indices are back Above the … [Read more...]
- « Previous Page
- 1
- …
- 184
- 185
- 186
- 187
- 188
- …
- 490
- Next Page »