
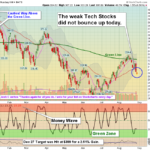
Markets were slightly lower today after Friday's big down day. The Tech Stocks were weak and did not bounce after the FED said that they might have to tighten and raise short term Interest Rates much more. Oil and Commodities were higher. Indices … [Read more...]
Money Wave Alert! Aug 29, 2022
Money Wave Alert! Aug 26, 2022
Markets were sharply lower today as the FED said that they might have to tighten and raise short term Interest Rates much more. Is the FED wanting to guarantee a big slow down, and right before an Election? Or are they bluffing? Indices are … [Read more...]
Money Wave Alert! Aug 25, 2022
Markets were higher today as the Indices were over-sold for the short term. The major Indices are still weak, but have corrected down to the Green Zones (probably too late to Sell for the short term), and should have Money Wave Buy Signals … [Read more...]
Money Wave Alert! Aug 24, 2022
Markets were slightly higher today as the Indices are over-sold for the short term. The Indices have corrected down to the Green Zones (probably too late to Sell for the short term), but no Buy Signals yet on the Indices. The strong US Dollar and … [Read more...]
Money Wave Alert! Aug 23, 2022
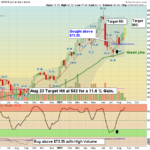
Markets were mixed today after yesterday's drop. The Indices are correcting some of the big rally for the last four weeks, on Wave 4 down. The Indices are quickly returning back down into the Green Zones and should be over-sold soon. Then we will Buy … [Read more...]
- « Previous Page
- 1
- …
- 183
- 184
- 185
- 186
- 187
- …
- 490
- Next Page »