
Markets were higher again today as the rally continued up on mild Buying. The US Dollar dropped more, which helped the Big Tech stocks. Now many are waiting on the FED to tighten more on Sep 21, but Smart Money seems to be betting that tightening … [Read more...]
Money Wave Alert! Sep 12, 2022
Money Wave Alert! Sep 9, 2022
Markets were sharply higher today as the US Dollar finally dropped below the Pink Line (10-day avg.) to create a short term Sell Signal. The Strong Dollar represents rising Interest Rates and hurts the Tech Stocks. Now many are waiting on the FED to … [Read more...]
Money Wave Alert! Sep 8, 2022
Markets were mixed today after yesterday's big rally, and the Indices stalled at the Pink Lines (10-day avgs.) Buying Volume was lower as many are not confident enough to Buy. We need to see long term Interest Rates and the US Dollar drop to bring in … [Read more...]
Money Wave Alert! Sep 7, 2022
Markets were finally higher today as long term Interest Rates and the US Dollar dropped. Short Sellers were covering, and there was mild Buying of the over-sold Markets. "Weak hand" investors were Flushed out on FEAR. We like to Buy on FEAR, and the … [Read more...]
Money Wave Alert! Sep 6, 2022
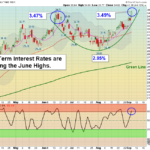
Markets were lower again today as long term Interest Rates "gapped up" higher. The Markets need the long term Rates to Double Top up here soon, for a Stock Market rally. The US Dollar made new highs today. More "weak hand" investors are being … [Read more...]
- « Previous Page
- 1
- …
- 181
- 182
- 183
- 184
- 185
- …
- 490
- Next Page »