
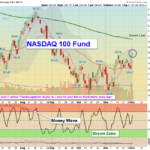
Markets were mixed again today after dumping out in the morning. The Dow 30, S&P 500 and Small Caps Indices are now back at or above the Green Lines, but over-bought for the short term. We are waiting for the Leaders to return to the Green Zones … [Read more...]
Money Wave Alert! Dec 2, 2022
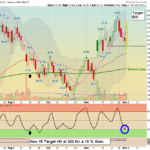
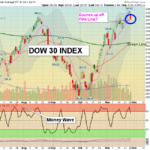
Money Wave Alert! Dec 1, 2022
Markets were mixed today after yesterday's big rally from the FED finally walking back their Tight Money Policy. The Dow 30, S&P 500 and Small Caps Indices are now back at or above the Green Lines, but over-bought for the short term. We are … [Read more...]
Money Wave Alert! Nov 30, 2022
Markets were sharply higher today as the FED indicated a smaller Interest Rate hike on their Dec 14th meeting. Recently when the Markets have started rolling over, the FED has come in and helped push the Market back up on good news. The Indices are … [Read more...]
Money Wave Alert! Nov 29, 2022
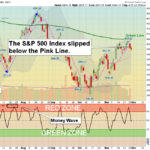
Markets were slightly lower today on more profit taking with low Volume. The Indices mostly fell below the Pink Lines, creating short term Sell Signals. We are waiting for more Leaders to return to the Green Zones for more Buy Signals. The US … [Read more...]
Money Wave Alert! Nov 28, 2022
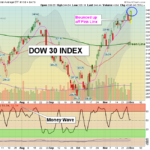
Markets were lower today on profit taking by the Institutions from last week's mild rally on low Volume. The Indices are struggling to re-test last week's highs, and the DOW 30 Index needs to bounce up here at the Pink Line to avoid a short term … [Read more...]
- « Previous Page
- 1
- …
- 169
- 170
- 171
- 172
- 173
- …
- 490
- Next Page »