
Markets were lower today as the major Indices and Leaders were over-bought and back up in the Red Zones (probably too late to Buy for the short term), The S&P 500 Index should bounce up near the Pink Line (10-day avg.) to avoid a short term Sell … [Read more...]
Money Wave Alert! Jan 18, 2023
Money Wave Alert! Jan 17, 2023
Markets were mixed today but the DOW 30 Index was lower on poor Goldman Sachs earnings. Volume was low and the major Indices and Leaders are over-bought and back up in the Red Zones (probably too late to Buy for the short term), Long Term Interest … [Read more...]
Money Wave Alert! Jan 13, 2023
MARKETS WILL BE CLOSED ON MONDAY JAN 16th FOR MLK HOLIDAY. Markets were slightly higher today on a low Volume trading day. The major Indices and Leaders are over-bought and back up in the Red Zones (probably too late to Buy for the short … [Read more...]
Money Wave Alert! Jan 12, 2023

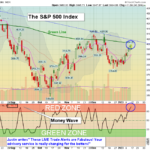
Markets were higher again today as the Inflation number dropped to 6.5% and retail investors piled in on the Good News. The S&P 500 Index is back up to the Green Line again, but is also over-bought and in the Red Zone (probably too late to Buy … [Read more...]
Money Wave Alert! Jan 11, 2023
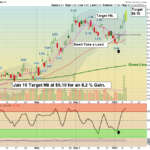
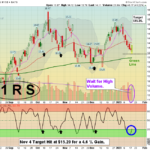
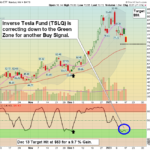
Markets were higher again today as the Leaders are hitting more Targets (see below). Volume was low, and several Inverse Funds below that actually meet the Green Line Rules should have Buy Signals soon. Slowly the high Interest Rates are causing … [Read more...]
- « Previous Page
- 1
- …
- 163
- 164
- 165
- 166
- 167
- …
- 490
- Next Page »